

Financial markets adjust frequently to news, sending clues about how the economy is functioning. To expand our understanding of these market perspectives, the San Francisco Fed has increased the update frequency for our Proxy Funds Rate page from the original monthly schedule started in 2022 to new weekly data updates.
The weekly proxy funds rate uses financial market indicators to show the influence of the Federal Reserve’s forward guidance and asset sheet actions beyond what can be seen through the level of the federal funds rate.
Tracking economic news through a financial market lens
In our FRBSF Economic Letter “Anatomy of the Post-Pandemic Monetary Tightening Cycle,” we describe how we extend the proxy funds rate to a weekly frequency. This series extends previous work (Doh and Choi 2016 and Choi et al. 2022), where the series was computed for each month.
In both cases, the idea is that, when the Federal Open Market Committee (FOMC) issues forward guidance—communicating the likely course of future monetary policy—or makes changes to the size or composition of the Federal Reserve’s balance sheet, these actions affect financial markets. The proxy rate translates a set of financial variables into a rate that is comparable to the federal funds rate.
The monthly and new weekly series move closely together. However, too much happens over the span of a month to identify possible reasons for changes in the rate. The more precise variation in the weekly rate allows us to pinpoint specific catalysts for the changes we observe.
For example, the weekly series can help better understand, through the lens of financial markets, how the anticipated stance of policy can react to incoming news. Our Economic Letter highlights that, between 2021 and 2023, most of the tightening occurred outside of weeks with explicit changes in policy. Some of this tightening came from monetary policy news—speeches by Chair Jerome Powell or releases of the minutes of FOMC meetings—and some of it came from economic data news about inflation or employment.
Figure 1
Weekly and monthly proxy funds rates and effective federal funds rate, 2020-present
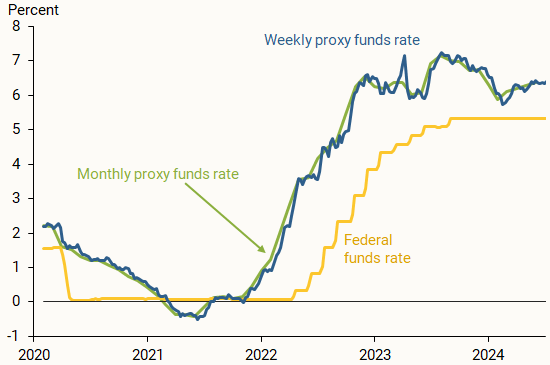
Weekly updates to proxy funds rate data
To continue tracking how the stance of monetary policy evolves, we will update the proxy funds rate chart and data series every week on our data page. We will continue updating the monthly series through the downloadable data file, as well.
How this series evolves can help gauge much more than how fast policy is tightening or loosening. Weekly tracking can provide insights to help identify the reasons why and how much markets are reacting to incoming news, as well as how markets assess policy might change in the future.
References
Choi, Jason, Taeyoung Doh, Andrew Foerster, and Zinnia Martinez. 2022. “Monetary Policy Stance Is Tighter than Federal Funds Rate.” FRBSF Economic Letter 2022-30 (November 7).
Doh, Taeyoung, and Jason Choi. 2016. “Measuring the Stance of Monetary Policy on and off the Zero Lower Bound.” FRB Kansas City Economic Review 101(3), pp. 5–21.
Foerster, Andrew, and Zinnia Martinez. 2024. “Anatomy of the Post-Pandemic Monetary Tightening Cycle.” FRBSF Economic Letter 2024-16 (June 24).
The views expressed here do not necessarily reflect the views of the management of the Federal Reserve Bank of San Francisco or of the Board of Governors of the Federal Reserve System.