Regional data provide indicators measuring characteristics of the dual mandate across the nation. This page provides data on labor market conditions, prices, and earnings for the 50 states and the District of Columbia and also for selected metropolitan areas within the SF Fed’s 12th District.
Labor Markets
The data in these maps are based on monthly observations from the Bureau of Labor Statistics (BLS). States in the 12th District—Alaska, Arizona, California, Hawaii, Idaho, Nevada, Oregon, Utah, and Washington—are highlighted in yellow. The overall U.S. value for each is included below the maps for comparison.
Unemployment Rates by State (%)

Source: Bureau of Labor Statistics and FRBSF staff calculations.
Payroll Employment Growth Rates by State (%)

Source: Bureau of Labor Statistics from the establishment survey and FRBSF staff calculations.
Vacancy-to-Unemployment Ratios by State
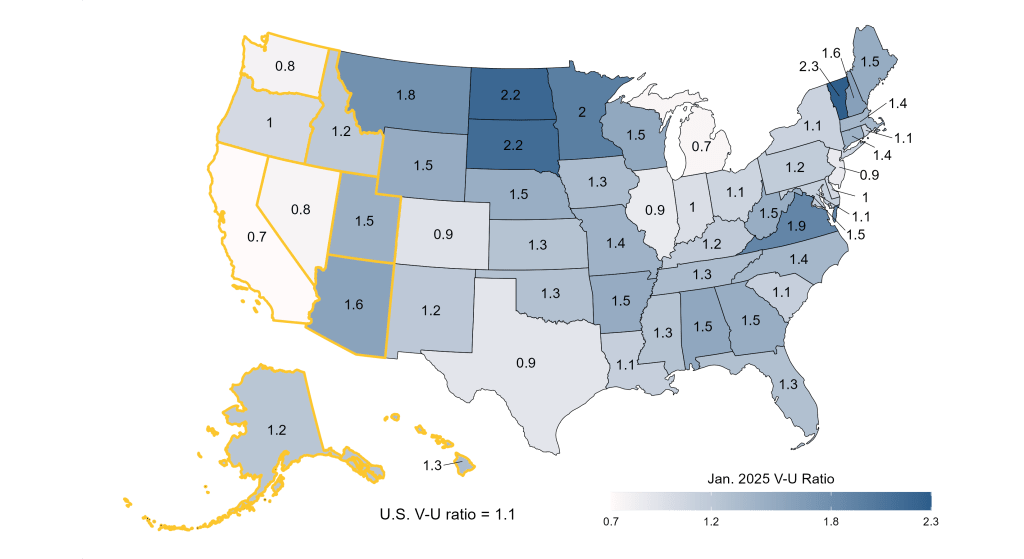
Source: Bureau of Labor Statistics and FRBSF staff calculations.
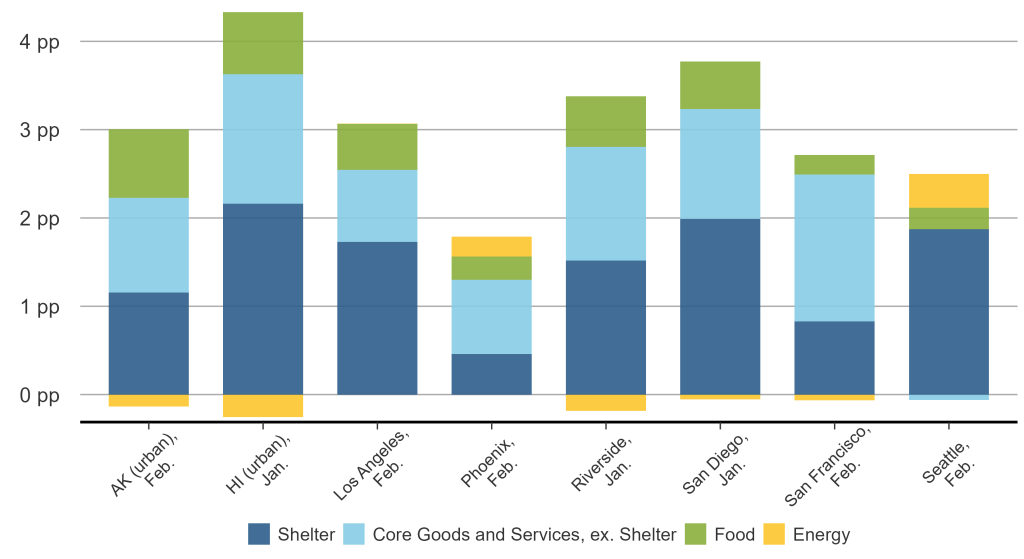
Prices and Earnings
Prices and earnings growth are closely related. Data in this section allow the comparison of prices and earnings growth and their differences across regions.
Source: Bureau of Labor Statistics and FRBSF staff calculations.
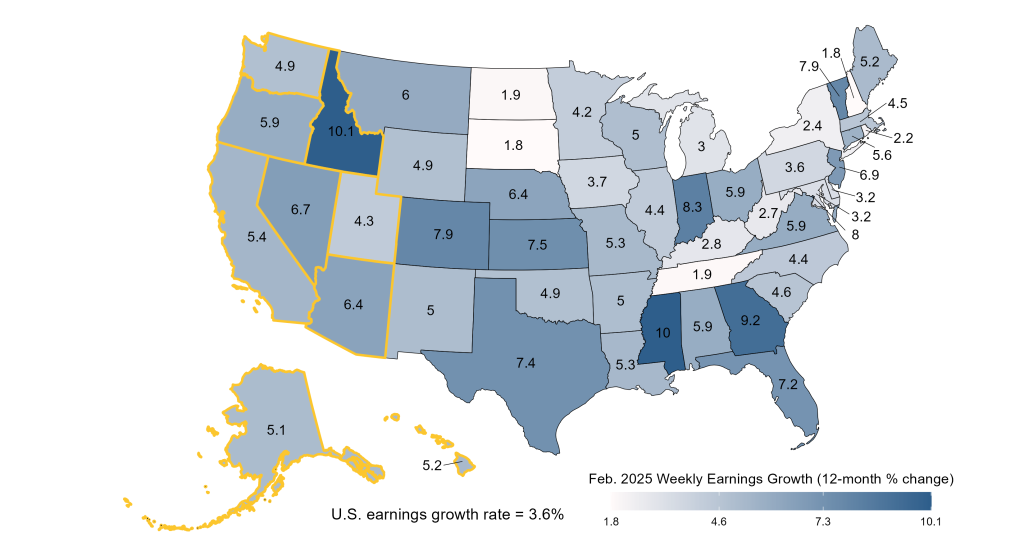
Source: Bureau of Labor Statistics from the establishment survey and FRBSF staff calculations.
Consumer price index for selected metro areas in the 12th District (pdf, 621 kb)
Download Data
Contact Evgeniya.Duzhak (at) sf.frb.org and Leila.Bengali (at) sf.frb.org