One of the striking trends in recent economic history is Asia’s growing importance in global investment flows. Over the past two decades, the region emerged as a large net creditor to the rest of the world. The net position, however, does not necessarily tell the entire story. A deeper examination of Asia’s overseas assets reveals the differences in how Asian economies invest abroad.
Asia’s overseas assets have now grown to more than $28 trillion. The flow of investment has not been one-way; the rest of the world now has claims on Asian economies equivalent to $21 trillion. The difference between foreign assets and foreign liabilities, the net international investment position, is a measure of an economy’s status as an overall debtor or creditor.
Figure 1 shows the growth of Asia’s net international investment position since 2004. From the chart, it’s clear that several economies play an outsized role in Asia’s status as a net creditor. Japan, China, Hong Kong, and Taiwan all enjoy large positive external positions. In contrast, India and the ASEAN-4 countries (combined) are net debtors and South Korea has recently emerged with a small positive position.
Asia Net International Investment Position (USD MN)

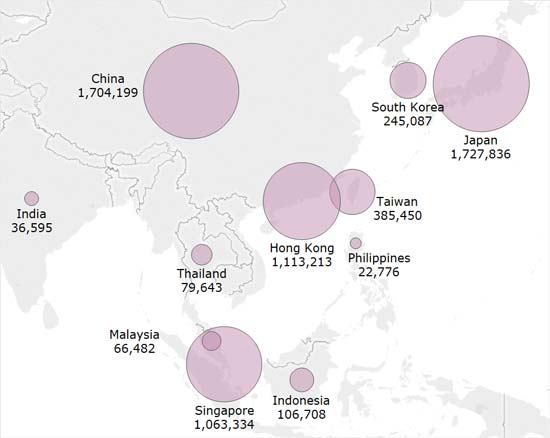
Analyzing the composition of total assets, as opposed to net assets, shows large differences among the Asian economies. Foreign direct investment is one of the key channels by which capital flows out of Asia. China’s rise as a center of outward direct investment has attracted significant attention in recent years. However, as Figure 2 illustrates, Japan’s stock of outward investment remains larger than China’s. The statistics are complicated by the roles of Hong Kong and Singapore as investment hubs. Both financial centers serve as bases for multinational companies investing in other economies in the region. In the case of Hong Kong, a portion of outward investment is roundtrip investment by Chinese firms that returns back to China.
Outward Direct Investment (USD MN)

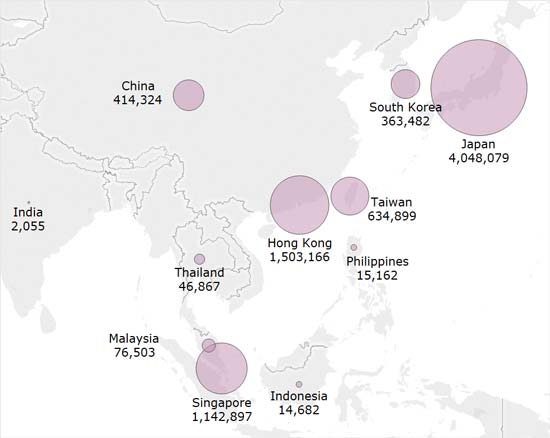
Another major component of foreign assets is portfolio investment, the purchase of overseas stocks and bonds. Here, as shown in Figure 3, the division amongst Asian economies is highly skewed. Japan is the largest holder of foreign securities by a wide margin, with nearly as much as the rest of Asia combined. Hong Kong and Singapore also stand out due to their role as international financial centers. In comparison, China’s overseas investment holdings are quite low relative to the size of its economy due to its ongoing capital controls. India ranks well behind many of the ASEAN economies in terms of overseas securities holdings, a surprising fact given the overall size of its economy, the third largest in Asia.
Outward Portfolio Investment (USD MN)

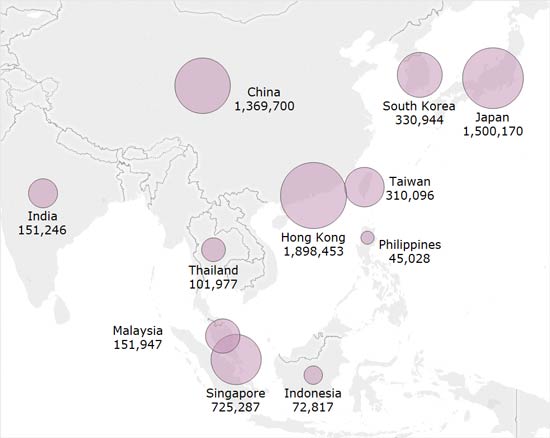
A similar pattern holds for “other investment,” which is a category that includes cross-border loans, trade credit, and holdings of foreign currency and deposits. Figure 4 shows the distribution of these assets held by Asian economies. For Japan and China, the bulk of their holdings come in the form of overseas loans, a result of the significant cross-border expansion of many of their banks. Hong Kong and Singapore also loom large driven by their large holdings of foreign currencies, a reflection of their role as international financial centers.
Cross-border Loans, Trade Credit, Foreign Currency and Deposits (USD MN)

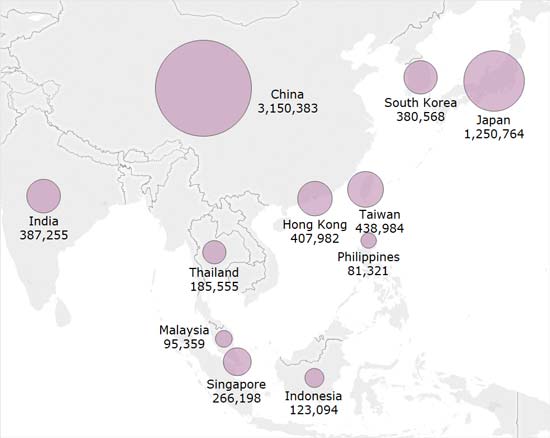
Foreign exchange reserves are the final major piece of Asia’s external claims, accounting for nearly a quarter of total foreign assets. As Figure 5 shows, foreign exchange reserves are the largest portion of China’s overseas assets. The same is true for Indonesia, Thailand, South Korea, India, and the Philippines. The large amount of assets tied up in foreign exchange reserves, typically invested in low-yielding sovereign debt, contributes to the relatively low rates of return on Asia’s foreign assets. The balance of payments accounts for many Asian economies, even some with large net international investment positions, show investment returns that are low or negative. This is driven by the gap between low returns received on foreign assets and higher returns paid on foreign liabilities.
Foreign Exchange Reserves (USD MN)

The combined net international investment position of the Asian economies above was equal to $7.4 trillion as of the most recent data available. This stands in stark contrast to the position of United States which was negative $7.9 trillion as of Q2 2017. Examining the foreign assets and liabilities of the United States also yields further insights. The stock of US foreign assets was equal to almost $26 trillion, not significantly behind the combined assets of all Asian economies ($28.8 trillion). Reserve assets accounted for less than 2 percent of assets, compared to 24 percent for Asia.
U.S. foreign liabilities are also enormous, $33.9 trillion compared to $21.3 trillion for the Asian economies combined. The bulk of U.S. liabilities are portfolio investment, reflecting the openness of U.S. bond and stock markets. The large amount of US assets held by foreigners is also closely linked to the dollar’s role as the preeminent global currency. Despite its large negative international investment position, the US has a positive overall balance of investment income, meaning that it receives more on its overseas assets than it pays on its liabilities to foreigners. This is driven by high returns on U.S. overseas direct investment and the concentration of foreign claims in low-yielding U.S. treasuries, many of which are held by Asian central banks.
Asia has become a major source of global investment, measured by both total foreign assets and overall net investment position. The form and amount of investment, however, varies tremendously across the region. This is most clear with cross-border securities purchases and lending, where several large Asian economies barely register. The accumulation of foreign exchange reserves has been widespread across the region, but these investments offer comparatively low rates of return, particularly in a low interest rate environment. This may shift towards a more balanced pattern as these economies develop and become richer. Asia’s role as a global investor is set to continue growing and the region will shape cross-border capital flows for years to come.
The views expressed here do not necessarily reflect the views of the management of the Federal Reserve Bank of San Francisco or of the Board of Governors of the Federal Reserve System.
