

Andrew Foerster, senior research advisor at the Federal Reserve Bank of San Francisco, stated his views on the current economy and the outlook as of May 30, 2024.
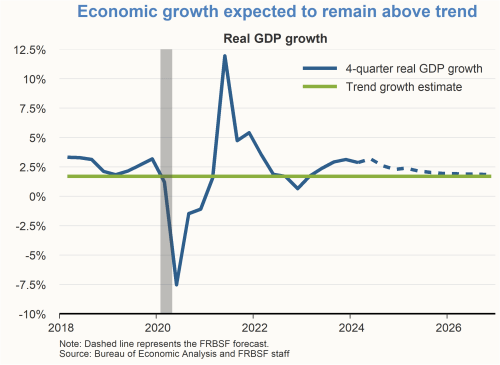
- Real gross domestic product (GDP) grew at a 1.3% annualized rate in the first quarter of 2024. The four-quarter growth rate for 2023 was 2.9%, which is well above our 1.7% estimate of trend growth. Given the restrictive stance of monetary policy, we expect real GDP growth to slow towards trend over the forecast horizon.
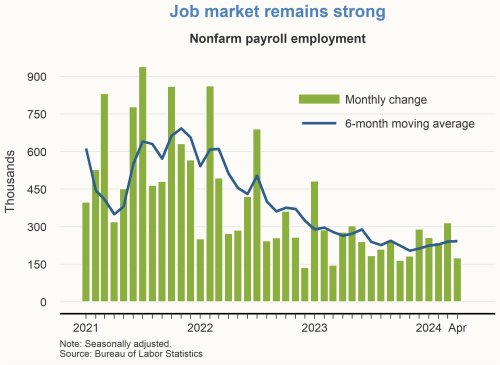
- The labor market remains strong. Payroll employment grew by 175,000 jobs in April 2024, which is somewhat lower than the previous several months. Nonetheless, it indicates solid job growth that exceeds the number needed to keep pace with normal labor force growth. The unemployment rate ticked up to 3.9% in April but remains at a level consistent with a tight labor market.
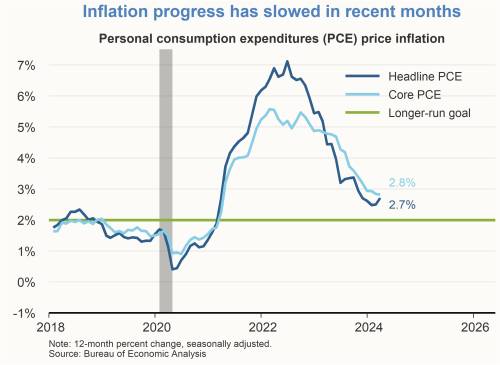
- The 12-month headline personal consumption expenditures (PCE) inflation rate was 2.7% in March 2024, while the 12-month core PCE inflation rate, which removes volatile food and energy categories, was 2.8%.
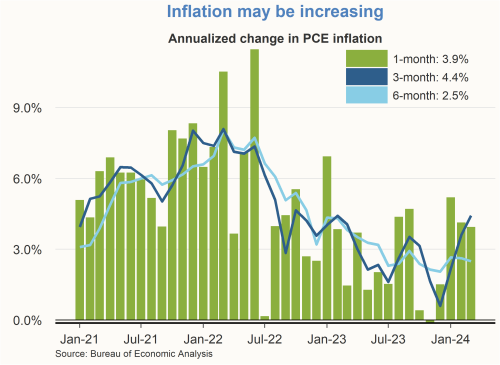
- Inflation data in recent months have been mixed, and progress towards the Federal Reserve’s 2% longer-run goal may have slowed. Monthly PCE inflation readings for the first three months of 2024 suggest that inflation may be increasing from levels observed towards the end of 2023. The three-month annualized change in the PCE price index in March was 4.4%, up from 0.6% in December 2023. However, April inflation readings measured by the consumer price index suggest that the elevated inflation readings in the first quarter might not continue into the current quarter, raising the possibility of renewed declines in headline and core PCE inflation in coming months.
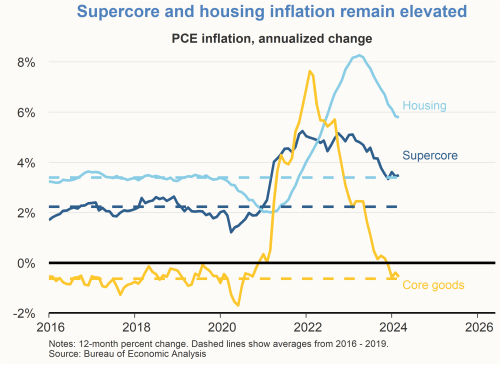
- The components of core PCE inflation can be divided into three categories: core goods, core services excluding housing, which is often called “supercore” inflation, and housing. Inflation measured by each of these categories has declined over the past 12 months. The 12-month core goods inflation rate has declined from almost 8% in early 2022 to below 0% currently, which is a level consistent with the pre-pandemic average value. Supercore and housing inflation have both declined from their peaks but remain well above pre-pandemic average values. Supercore inflation has remained relatively steady since late 2023.
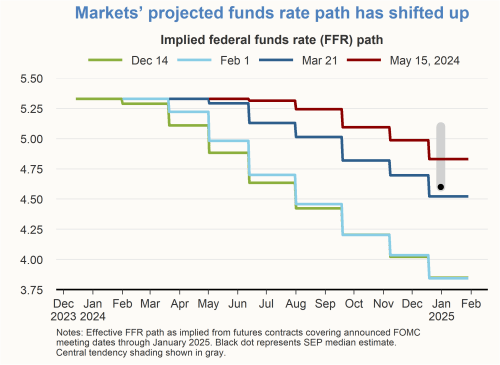
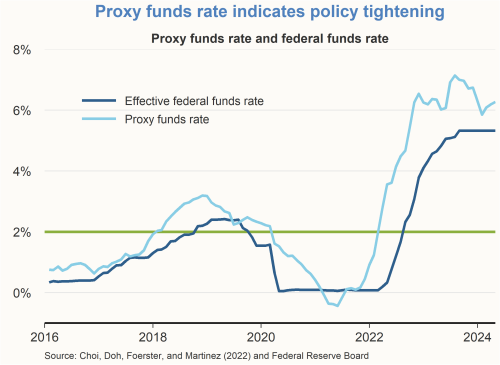
- Financial markets are projecting a markedly higher path for the federal funds rate relative to the path projected at the end of 2023. In December 2023, markets were projecting the Federal Reserve to make a total of six 25 basis point cuts in the federal funds rate by year-end 2024. In May 2024, the market is now projecting only two 25 basis point cuts by year-end 2024. Consistent with these projections, the proxy funds rate, which summarizes the broader stance of monetary policy, has increased since January 2024.
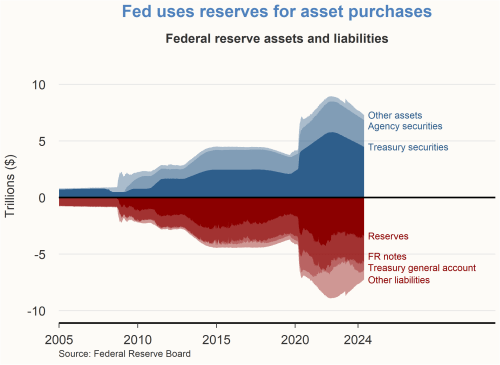
- Following the conclusion of the Federal Open Market Committee (FOMC) meeting on May 1, 2024, the Committee announced its decision to slow the runoff in the Federal Reserve’s balance sheet starting in June. The size of the balance sheet has been declining from almost $9 trillion in June 2022 to a little over $7 trillion in May 2024. As their holdings of Treasury securities, agency securities, and other balance sheet assets decline, the level of reserves in the banking system also declines.
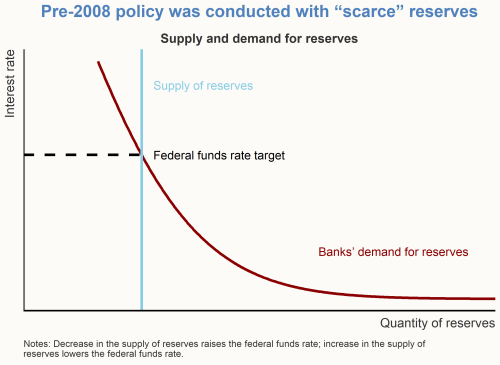
- Prior to 2008, the Federal Reserve implemented monetary policy using scarce reserves in the banking system, with higher interest rates serving to lower the demand for reserves coming from banks. Given this demand for reserves, the Federal Reserve controlled the supply of reserves to achieve the desired target for the federal funds rate.
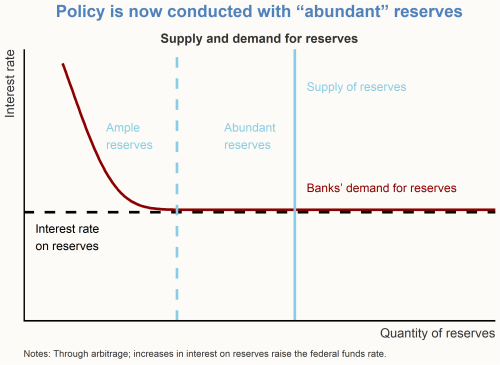
- Monetary policy is now implemented using abundant reserves in the banking system. The payment of interest on reserve balances serves to put a floor under the interest rate and flatten the demand curve for reserves coming from banks. With a flat demand curve, small variations in the supply of reserves have negligible effects on the interest rate. But if the supply of reserves declines by a large amount, the demand curve will begin to steepen as reserves become scarce. An ample level of reserves is lower than the current abundant level but still exceeds the level of scarce reserves employed prior to 2008. The FOMC has stated that it intends to implement monetary policy using an ample level of reserves in the banking system.
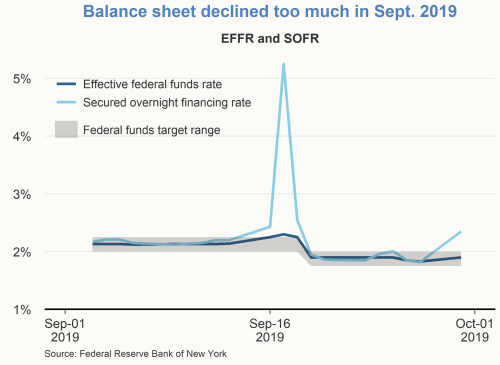
- The FOMC’s previous experience with balance sheet runoff before the pandemic provides lessons for the current experience. In September 2019, the size of the balance sheet declined to a level where reserves started to become scarce, leading to higher rates in the banking system. These developments caused the effective federal funds rate (EFFR) to briefly exceed the upper end of the FOMC’s target range. In addition, the secured overnight financing rate, which usually closely tracks the EFFR, spiked to over 5%. In response to these events, the FOMC determined that banking system reserves had become too scarce, so the Committee increased the size of the balance sheet to return to a regime of ample reserves.
Charts were produced by Zinnia Martinez.
About the Author
Andrew Foerster is a senior research advisor in the Economic Research Department at the Federal Reserve Bank of San Francisco. Learn more about Andrew Foerster
The views expressed are those of the author, with input from the forecasting staff of the Federal Reserve Bank of San Francisco. They are not intended to represent the views of others within the Bank or within the Federal Reserve System. This publication is edited by Kevin J. Lansing and Karen Barnes. FedViews appears eight times a year, generally around the middle of the month. Please send editorial comments to Research Library.