Nicolas Petrosky-Nadeau, vice president at the Federal Reserve Bank of San Francisco, shared views on the current economy and the outlook from the Economic Research Department as of January 16, 2025.
The U.S. economy continues to create jobs at a robust pace even while monetary policy remains restrictive. Inflation has declined gradually over the past year but remains above the Federal Reserve’s 2% longer-run goal. Achieving the earlier significant declines in inflation without a significant rise in the unemployment rate was aided by favorable tradeoffs between job vacancies and unemployment, and between labor market slack and inflation. These Beveridge and Phillips curve tradeoffs may become less favorable going forward, contributing to the uncertainty over the outlook.
Labor market has remained healthy as inflation declined
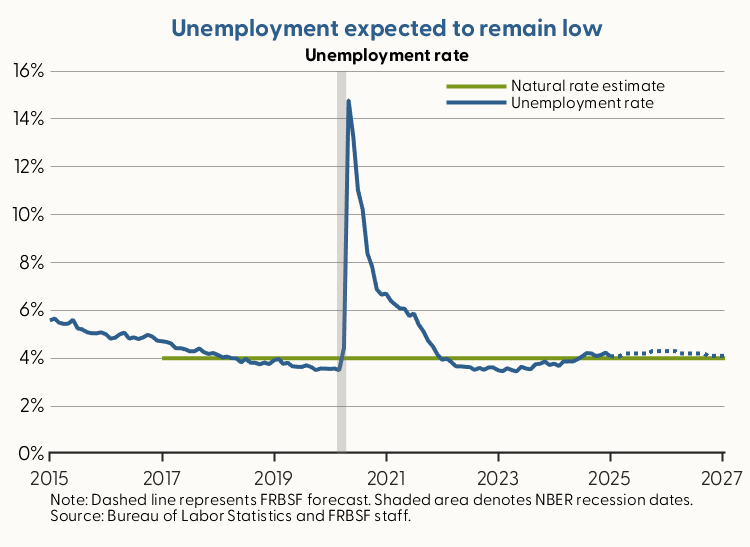
The labor market continues to create jobs at a robust pace, and the unemployment rate remains low. The December 2024 report from the Bureau of Labor Statistics showed that the economy added 256,000 jobs during the month, and the unemployment rate edged down, closing the year at 4.1%.
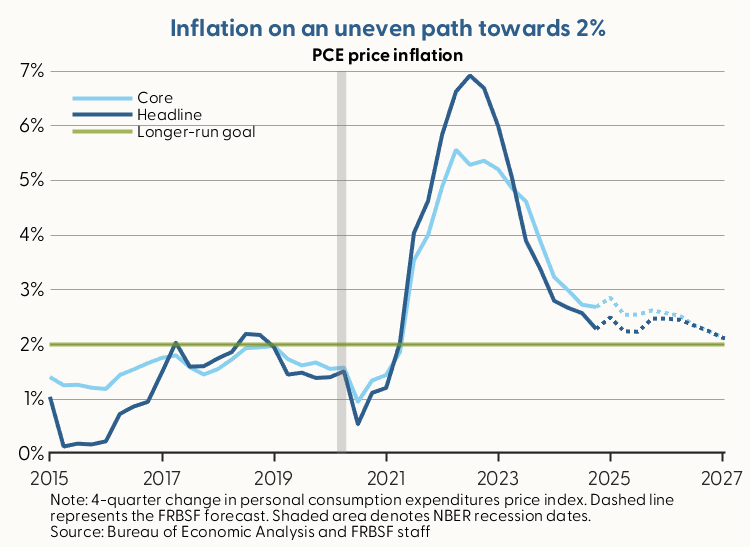
Inflation continued to decline in 2024, but at a slower pace relative to 2023. The 12-month change in the headline personal consumption expenditures (PCE) price index was 2.4% in November 2024. This reading is down from 2.7% in November 2023 and 6.0% in November 2022.
The slower pace of disinflation in 2024 coincided with continued strength in consumer spending. While overall goods prices have fallen over the past year, inflation in services categories has been persistent. Against this backdrop, we expect headline PCE inflation to remain somewhat above the Fed’s 2% goal in the near term but reaching 2% by the end of the forecast horizon.
Favorable tradeoffs supported a path to a soft landing
In March 2022, when monetary policymakers voted to increase the federal funds rate from its pandemic era low near 0%, the number of job vacancies exceeded the number of unemployed workers by almost a factor of two and inflation was at 40-year highs.
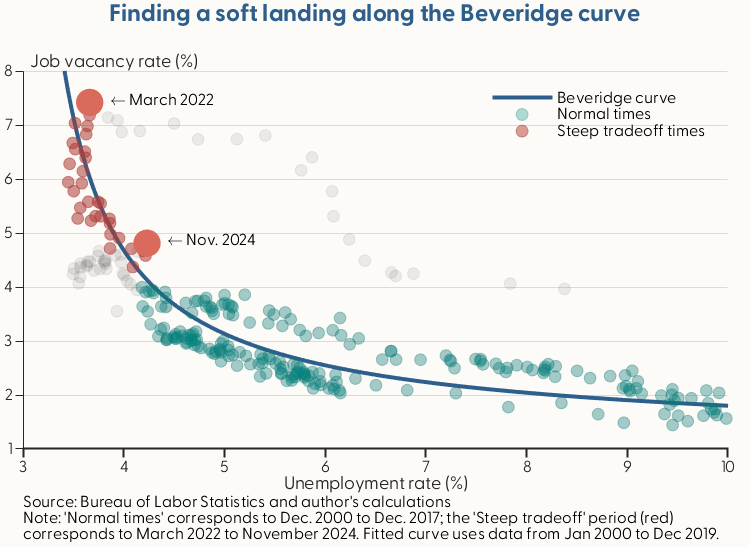
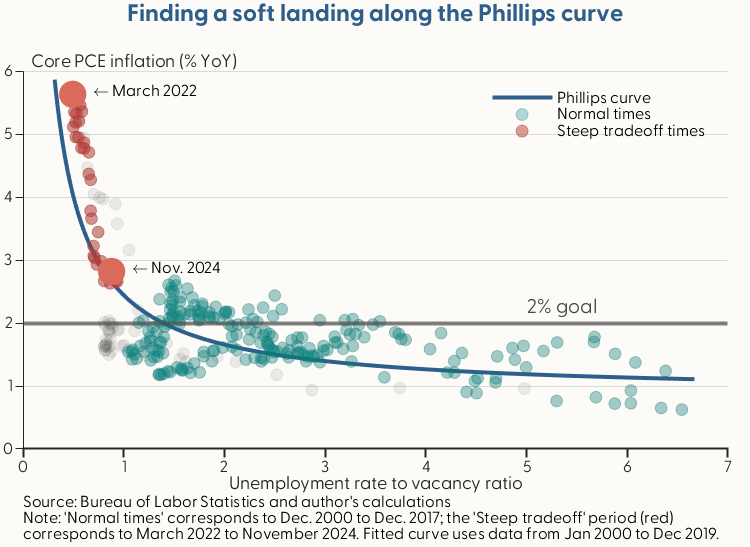
The path to restoring price stability without jeopardizing the health of the labor market can be understood as resting on two key empirical relationships in U.S. data: the Beveridge curve and the Phillips curve. The Beveridge curve shows the tradeoff between the job vacancy rate and the unemployment rate, both of which influence the degree of labor market slack, or the relative ease with which employers can fill vacant positions. Indeed, one useful measure of labor market slack is the ratio of the unemployment rate to the job vacancy rate, with higher ratios implying more slack. The Phillips curve shows the tradeoff between the degree of labor market slack and inflation, with more slack leading to lower inflation.
Data over the past three years suggest that the slopes of the Beveridge and Phillips curves both tend to increase—that is, the curves become steeper—at low levels of labor market slack. This steepening effect helps explain how a mildly cooling labor market can coincide with a substantial decline in inflation, thereby supporting a path to a soft landing. That is, a decline in the job vacancy rate along a steep Beveridge curve can occur with a very small rise in the unemployment rate: jobs remain plentiful and job seekers continue to rapidly find employment. A steep Phillips curve implies that a relatively small increase in the unemployment-to-vacancy ratio can bring about a substantial decline in inflation.
The data received since March 2022 confirm this scenario. The job vacancy rate declined from 7.4% in March 2022 to 4.8% in November 2024. Over the same period, the unemployment rate rose from 3.7% to 4.2%, resulting in a modest rise in the degree of labor market slack. At the same time, the 12-month core PCE inflation rate declined substantially from 5.6% to 2.8%
Further modest labor market cooling expected
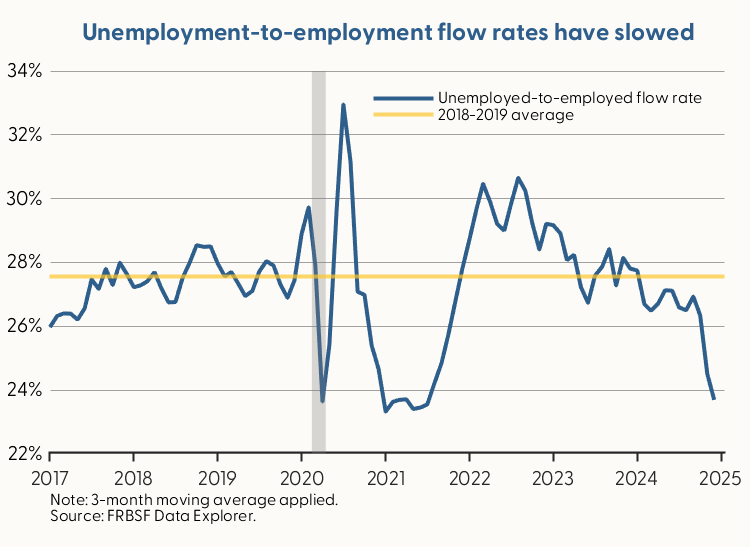
Current labor market conditions are less favorable to workers when compared to the healthy pre-pandemic conditions from 2018 to 2019. Moreover, the pace at which the job seekers find work, as measured by the flow rate from unemployment to employment, has slowed markedly over the past 6 months, meaning lengthier spells of unemployment.
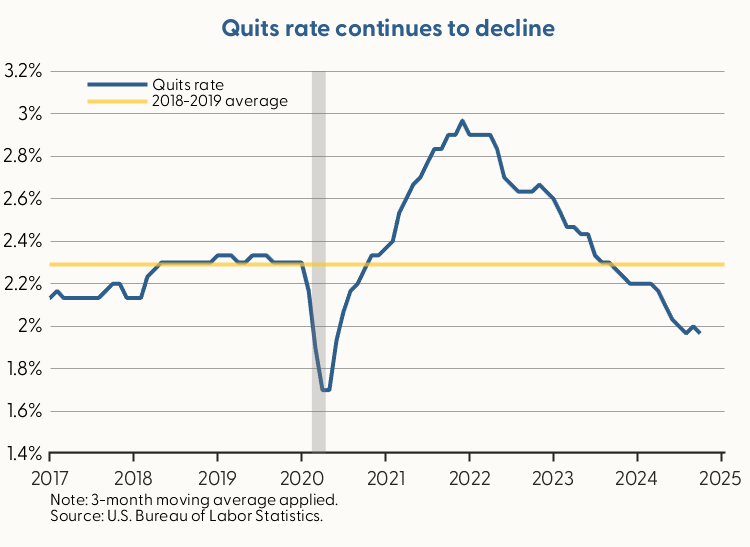
In this environment, workers are more likely to remain in their current jobs. The job quits rate, defined as the number of voluntary employee separations as a share of total employment, peaked in early 2022 but has since declined to levels last seen during the slow recovery from the Great Recession, suggesting less pressure on wage growth in the near term.
These labor market developments are expected to contribute to additional slack conditions over the next year and a continuation of the disinflationary process needed to reach the FOMC’s price stability goal. However, the tradeoff between inflation and labor market slack may become less favorable as the data approach the flatter portions of the Beveridge and Phillips curves.
Adverse supply shocks may delay a soft landing
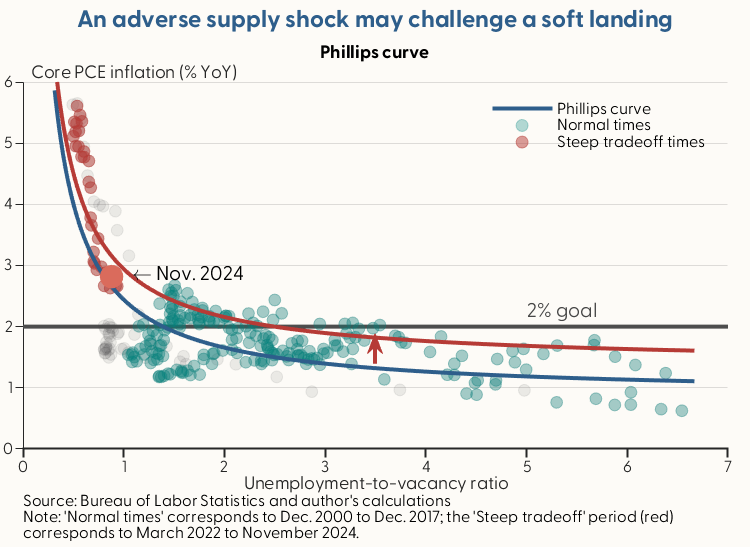
A separate risk factor for the outlook is the possibility of an adverse supply shock that increases inflation in the near term. This scenario might arise, for example, due to reductions in the supply of labor, an increase in oil prices, or the imposition of tariffs, all of which could raise costs of production.
An adverse supply shock would temporarily shift the Phillips curve upward, resulting in higher inflation for any given degree of labor market slack. This less favorable Phillips curve tradeoff would complicate the FOMC’s efforts to balance its dual mandate goals of price stability and maximum employment. Specifically, a larger increase in labor market slack may be needed to bring inflation down to 2% until such adverse supply conditions dissipate.
Shifting policy outlook
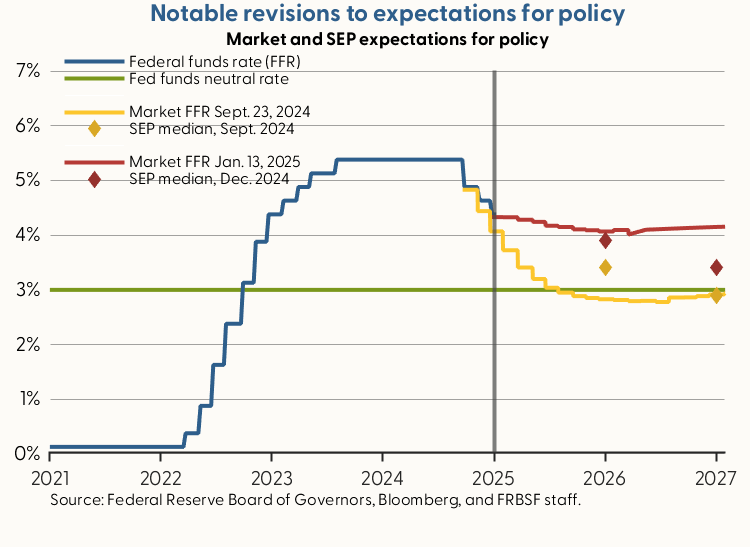
Given the recent evolution of the data and the possibility of less favorable Beveridge and Phillips curve tradeoffs going forward, policymakers and market participants have shifted up their projected paths for the federal funds rate over the next two years. Long-term Treasury yields and mortgage rates have also shifted up, contributing to a somewhat tighter stance of monetary policy that is expected to support a return to price stability by the end of the forecast horizon.
Charts were produced by Sabrina Considine.
The views expressed are those of the author with input from the Federal Reserve Bank of San Francisco forecasting staff. They are not intended to represent the views of others within the Bank or the Federal Reserve System. This publication is edited by Kevin J. Lansing and Karen Barnes. SF FedViews appears eight times a year. Please send editorial comments to Research Library.

