Access to water is necessary to sustain human civilization and agricultural production. Recent analysis finds that most of U.S. land area, economic activity, and agricultural production are in regions with stable to positive trends in local water availability. This provides reassuring news about overall U.S. vulnerability to water resource depletion. However, some Western and Southwestern regions are facing serious water risks that scientists expect to become more severe over time, suggesting that efforts to alleviate this concern should have a regional focus.
The world’s water resources are constantly evolving. While the total quantity of water contained within the earth and its atmosphere is fixed over time, the water available for human consumption in a given place can shift markedly over time. Water can gradually move from the land into the oceans (Tapley et al. 2019), where it is prohibitively expensive to desalinate for human use. It can also move away from certain regions that grow drier even as other regions simultaneously grow moister. The evolution of fresh water in any given place depends on complex interactions between a wide range of factors involving both human societies and the underlying climate.
Recent work by Carleton, Crews, and Nath (2024) assesses global trends in water resources from 2003 to 2022 and considers their potential economic consequences. The authors find that, perhaps surprisingly, the net global change in water resources on arable land over these decades is almost exactly zero, with roughly equal proportions of the world’s arable land gaining and losing water over time. Concern may be warranted for some locations that have been losing water rapidly—especially because those are concentrated in parts of the world with large populations, low existing water resources, and relatively unproductive cropland.
This Economic Letter extends the analysis of Carleton, Crews, and Nath (2024) to focus on the potential vulnerability of the U.S. economy, population, and agricultural sector to water scarcity. Overall, our analysis suggests that the U.S. story largely mirrors that of the world, with stable aggregate water resources but sharp declines concentrated in already dry regions. These declining regions tend to have substantial agricultural activity but relatively less fertile land.
Trends in U.S. water resources
Until recently, little systematic information has been available for measuring water resource trends. Observational measurements from wells and gauges measuring groundwater, rivers, and rainfall have been limited by inconsistent geographic and temporal coverage. This makes it difficult to understand broad trends in water resources and their effects on local economies. In recent decades, however, scientists have made tremendous advances in measurement. Most notably, data compiled by the Gravity Recovery and Climate Experiment (GRACE) partnership between NASA and the German Space Agency uses satellite measurements of small changes in the earth’s gravitational pull to infer changes in the total volume of water stored in each place in the world, including groundwater, lakes, rivers, soil moisture, ice, and snow (Tapley et al. 2004).
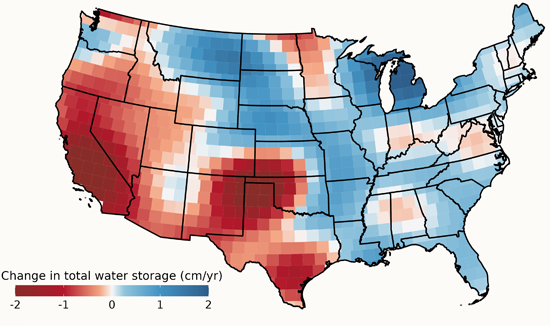
Figure 1 shows the map of GRACE trends in total water storage from 2003 to 2022 across the contiguous United States. Regions are colored according to whether they are losing water (red) or gaining water (blue), with more intense colors corresponding to more extreme trends. Most of the western and southwestern United States has been losing substantial quantities of water: Almost all of the land in the bottom 10% of water trends are located in central and southern California and the Ogallala aquifer region at the intersection of Texas, Oklahoma, Kansas, New Mexico, and Colorado. Some of these regions are in the top 1% for water depletion among all global arable land. By contrast, the Great Plains and upper Midwest have largely been gaining water resources, and the vast majority of land east of the Mississippi River has seen stable to increasing water resources over time.
Figure 1
Trends in total water storage

Overall, water availability has been rising on about 54% of the land in the contiguous United States and decreasing on 46%. On net, total U.S. water volumes have declined slightly as the drying regions have lost more water than the moistening regions have gained, though aggregate losses are only 0.04% of average annual U.S. rainfall.
The total availability of water resources may be less informative than their spatial distribution across the U.S. geography. Unlike most other inputs into economic production, water cannot be easily traded across space. While it is possible to send machines and parts across the country to where they are most needed, it is virtually impossible to water crops in California or take a shower in Phoenix with water imported from Michigan. Thus, the spatial overlap between water resources, economic activity, and human populations is important for assessing the implications of the data.
How many Americans are directly affected by water scarcity?
To assess the potential consequences, we track how trends in local water resources across the United States relate to existing levels of water resources. Intuitively, each extra unit of water might not add as much social or economic value in places with many lakes and rivers as it would in places that are relatively water scarce. Thus, the potential economic risks associated with depleting water resources are greater in areas that are already dry.
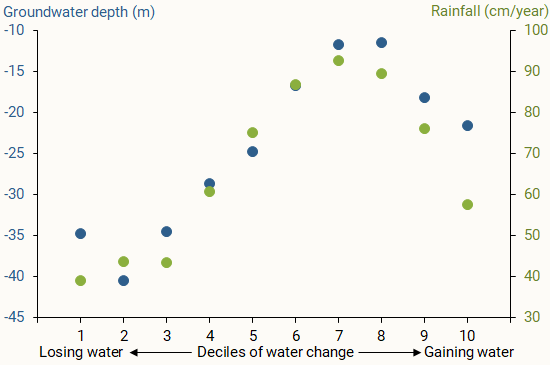
Figure 2 shows that this seems to be the case within the United States. The horizontal axis shows the rates of change in water resources, dividing the indexed sample into 10 even portions, or deciles; regions that lose water the fastest are on the left, and regions that gain water the fastest are on the right. The vertical axis shows existing levels of water resources in these locations, with green dots measuring average annual rainfall and blue dots showing average groundwater availability. The figure shows that those regions losing water the fastest also tend to be places with little rainfall and relatively low water tables far beneath the earth’s surface. These consist largely of parts of southern California, Nevada, Arizona, New Mexico, and western Texas. In contrast, places like the Great Lakes region are already wet and getting wetter over time. Geographically, the trends suggest that water-rich locations are getting more water, while water-poor locations are losing water over time.
Figure 2
Rainfall and groundwater relative to water availability

The impact on well-being in terms of human settlement and economic activity depends in part on how many people live in these water-scarce regions experiencing rapid depletion. If a puddle dries up in an uninhabited desert, fewer people may notice. But if major population centers are at risk, the implications could be much more serious. Encouraging data show Americans are disproportionately living away from depleting regions, with 64% of the U.S. population currently living in locations that are gaining water over time. However, a sizable share of people live in places that are losing water rapidly. That includes over 40 million Americans located in the bottom 10% of the water trend distribution, as well as major cities such as San Francisco, Los Angeles, San Diego, Phoenix, Houston, and Austin, which are all in the bottom quarter of the distribution. The patterns for economic activity are similar, with 61% of GDP originating from places gaining water. Data on population and economic activity trends show little change over recent decades in the spatial correlation of people, economic activity, and water loss, with depleting regions growing in population approximately as quickly as nondepleting regions.
How are water resource trends affecting U.S. agriculture?
An especially important dimension of the economic implications of trends in U.S. water resources is their relationship with agricultural activity throughout the country. Scientists estimate that over 90% of global human water consumption occurs in agriculture, making it the sector most likely to suffer the consequences of declining resources—and also the one most likely to play a role in exacerbating existing trends.
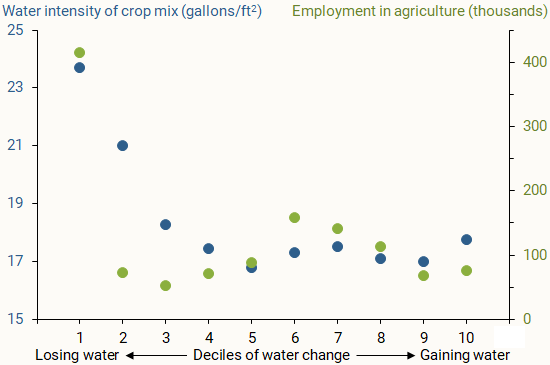
Figure 3 shows that U.S. agricultural employment is disproportionately concentrated in regions that are losing water the fastest. For locations in each category of water trends, green dots measure the level of agricultural employment. The farthest left green dot shows that regions in the bottom 10% of water resource trends have much higher levels of agricultural employment than all other areas, which are farther right on the graph. While agriculture’s average share of total employment is 0.85% nationally, it is nearly 2.3% of employment in these regions, driven largely by the substantial number of farmworkers in the Central Valley of California and around the Ogallala aquifer near the Texas panhandle. Over 35% of the nation’s total agricultural workers are in these 10% of regions losing water the fastest, even while the overall population is not especially concentrated in these locations.
Figure 3
Crop water intensity, ag employment by water availability

Figure 3 also shows that places with declining water resources coincide with very water-intensive agricultural activity. The blue dots, which measure the average volume of water required to grow one square foot of each region’s cropland to its full potential, are substantially higher in the water-losing regions on the left side of the figure. Locations in the bottom 10% of water trends (farthest left) have an average water intensity of agricultural land that is 22% larger than the national average. This pattern is driven largely by California, with its extensive production of water-intensive crops such as avocados, almonds, and alfalfa; the pattern broadly suggests that the agricultural economy in these places could be especially at risk from water depletion.
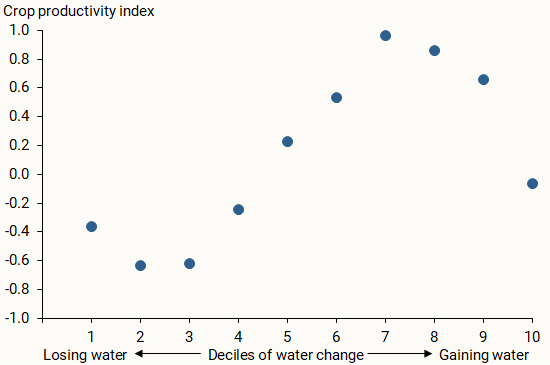
Somewhat paradoxically, Figure 4 shows that the country’s most productive agricultural land is located largely in places that are gaining water over time. The vertical axis represents an aggregate index based on scientific estimates of the average expected yield across crops for each unit of cropland relative to other units of cropland in the country. Water losses (left side) concentrate heavily in parts of the Southwest with relatively low potential for crop growth, despite their relatively high share of agricultural employment, shown in Figure 3. By contrast, regions with the highest crop productivity are largely those that have stable and increasing water resources (right side). As shown in Figure 1, these gaining regions are largely in the upper Midwest and the Southeast.
Figure 4
Crop productivity index by water availability

Thus, the overall story of trends in water resources and its potential effects on American agriculture is nuanced. Many farmworkers operate in locations vulnerable to rapid water depletion in the southwestern United States, and water-intensive crop growth there may be contributing meaningfully to observed rates of water decline. Yet, 61% of U.S. agricultural GDP comes from places that are gaining water. This is because places with stable water resources also happen to be especially productive in terms of agricultural output per unit of land and labor and thus account for a disproportionate share of total output.
Conclusion
This Letter finds that, while most of the contiguous United States is facing neutral to positive trends in total water availability, some already dry regions in the West and Southwest are rapidly losing water. Populations are not systematically concentrated in losing areas, and agricultural GDP mostly comes from places gaining water. However, those rapidly depleting regions have disproportionately high agricultural employment and water-intensive crop production. Thus, while the aggregate U.S. economy may not be under extreme threat from water scarcity, there are substantial regional concerns.
References
Tapley, Byron D., Michael M. Watkins, Frank Flechtner, et al. 2019. “Contributions of GRACE to Understanding Climate Change.” Nature Climate Change 9, pp.358–369.
Tapley, Byron, D., Srinivas Bettadpur, John C. Ries, Paul F. Thompson, and Michael M. Watkins. 2004. “GRACE Measurements of Mass Variability in the Earth System.” Science 305(5683), pp. 503–505.
Carleton, Tamma, Levi Crews, and Ishan Nath. 2024. “Is the World Running Out of Fresh Water?” AEA Papers and Proceedings 114(May), pp. 31–35.
Opinions expressed in FRBSF Economic Letter do not necessarily reflect the views of the management of the Federal Reserve Bank of San Francisco or of the Board of Governors of the Federal Reserve System. This publication is edited by Anita Todd and Karen Barnes. Permission to reprint portions of articles or whole articles must be obtained in writing. Please send editorial comments and requests for reprint permission to research.library@sf.frb.org
