Changes in overall economic conditions may affect real household income levels and also how income is distributed across households. Analysis using annual data from 1967 to 2023 shows that the adverse effects of unemployment and inflation have been generally uniform across the household income distribution. However, the pandemic recession showed a different pattern: Historically large government transfers via enhanced unemployment insurance benefits largely offset the adverse economic effects of surging unemployment for lower-income households. Results also show that sustained economic expansions have beneficial effects, especially for lower-income households.
Household income includes total earnings of all household members as well as other income sources, providing a broad measure of economic well-being and purchasing power. The level of income and the size of the gaps between low- and high-income households—the income distribution—may vary over business cycles, as unemployment and inflation change. Some research such as Blank and Card (1993) finds that changes in household income related to business cycle fluctuations tend to have uniform effects across the income distribution. By contrast, Aaronson et al. (2019) show that the response of various labor market indicators, such as unemployment and labor force participation, is larger for less economically advantaged groups.
In this Economic Letter, we update and extend past work by examining the effects of changes in unemployment and inflation rates on real household income and its components. We use data for the years 1967 to 2023, which include the pandemic period. We find that increases in unemployment and inflation reduce real household income. Prior to the pandemic, these cyclical effects were relatively uniform across the distribution of household incomes. The pandemic period was a substantial outlier, with income losses largely offset by historically large government transfers paid in the form of enhanced unemployment insurance (UI) benefits, especially for lower-income households. We also find that the effects of sustained economic expansions on household income are especially beneficial for lower-income households. Our results illustrate the beneficial effects of a successful monetary policy strategy, which minimizes economic fluctuations and supports expansions.
Long-term trends and the pandemic
We examine changes in real, or inflation-adjusted, household income during 1967–2023, using microdata from the Current Population Survey Annual Social and Economic Supplement (CPS ASEC). This source provides consistent data on annual income and is used for official Census Bureau statistics on income.
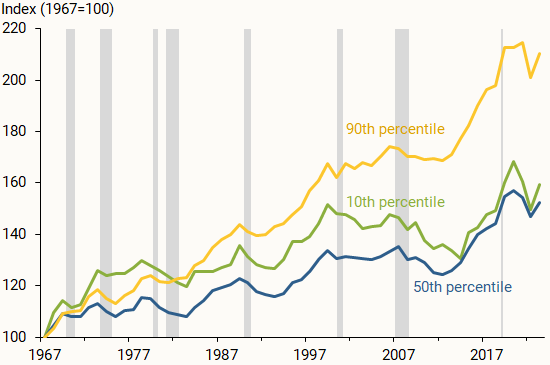
Figure 1 shows real household income growth measured at the 10th, 50th (median), and 90th percentiles, which are often used to summarize changes in the distribution or dispersion of income. We adjust the data for inflation using the overall CPI and normalize the values to equal 100 in 1967 for ease of comparison. Our series are corrected for underreporting of UI benefit payments, using the adjustment based on tax records developed by Larrimore, Mortenson, and Splinter (2022) and used in Valletta and Yilma (2024). The adjusted data are available for 1999–2021, but the primary impact of the adjustment is in the years 2020–21.
Figure 1
Annual real household income for selected percentiles

Source: FRBSF calculations using CPS ASEC microdata and corrected unemployment insurance benefits from Larrimore et al. (2022).
Figure 1 documents the long-term increase in income dispersion or gaps among households. The increase in dispersion has been limited to the upper half of the distribution, with households at the 90th percentile of the distribution approximately doubling their household income, while income for the 50th and 10th percentiles both rose slightly more than 50%. In a separate analysis that is not shown, we confirmed this pattern of higher income growth at higher percentiles for the interquartile range, the 25th/50th/75th percentiles, and also within the upper quartile, the 75th/90th/95th percentiles.
Accounting for the underreporting of UI benefits is important to accurately assess changes to household income during the pandemic. Official data released by the Census Bureau show that incomes declined in 2020 and 2021. However, the corrected data show that UI benefit payments fully offset income losses from unemployment in 2020 and partially offset them in 2021 (Valletta and Yilma 2024). The offset was especially large for households toward the bottom of the income distribution: Households at the 10th income percentile experienced a nearly 10% increase in real income in 2020 that was partly maintained in 2021, rather than the real income decline of nearly 8% reported in the official CPS ASEC data.
Overall, Figure 1 shows widespread gains in real income during economic expansions, with those gains offset somewhat during downturns.
Analyzing business cycle patterns
We next examine how business cycles affect real household income, specifically through changes in unemployment and inflation and also the duration of economic expansions. Our results are based on regression analysis of these relationships, for which we use the adjusted CPS ASEC microdata to tabulate national data measured on an annual basis. To minimize the influence of structural changes in the U.S. macroeconomy on our results, we use the deviation of the unemployment rate from the Congressional Budget Office’s measure of the natural rate of unemployment, referred to as the unemployment gap. Our regression results yield the percentage change in real household income when either the personal consumption expenditures (PCE) inflation rate or the unemployment gap increases 1 percentage point. All estimates have 5% or better statistical significance unless otherwise indicated.
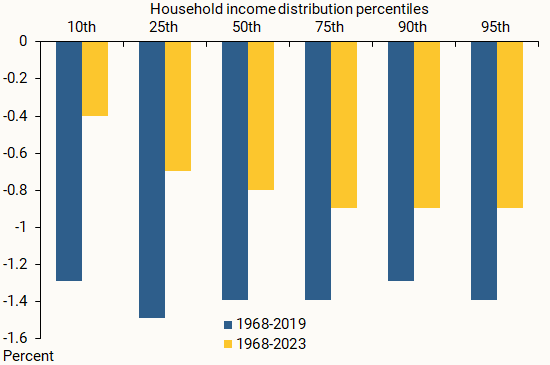
Figure 2 reports the estimated change in real household income for selected percentiles when the unemployment gap rises. The estimates use one sample for 1968 through 2019 (blue bars) and another through 2023 (gold bars) to include the pandemic. Based on the pre-pandemic sample, we find that a 1 percentage point increase in the unemployment gap is associated with about a 1 to 1.5% decline in real income for all of the income percentiles shown. These relatively uniform estimates imply no meaningful effects of unemployment fluctuations on income dispersion, consistent with Blank and Card (1993) for an earlier time period.
Figure 2
Real household income response to larger unemployment gap

Source: FRBSF calculations using CPS ASEC microdata and corrected unemployment insurance benefits from Larrimore et al. (2022).
The gold bars in Figure 2 show that the effects of unemployment fluctuations are more muted when the pandemic period is included. This is particularly evident for the lower portion of the distribution: The impact is relatively small and statistically indistinguishable from zero for the 10th and 25th percentiles. This indicates that the offsets to income losses during the pandemic, mainly via expanded UI benefits, were so large that they meaningfully altered the historical relationship between economic downturns and real household income.
We also estimated changes in real household income when the PCE inflation rate changes (not shown). We find that a 1 percentage point increase in PCE inflation is associated with about a 1/2 to 2/3 percentage point reduction in real household income. This is relatively uniform across household income percentiles, implying that the inflation tax on total income has minimal effects on income dispersion. This finding is broadly consistent with Bengali and Duzhak (2024), who find that high inflation periods reduce real earnings growth. However, our estimates indicate that inflation increases are associated with somewhat greater reductions in real income for the top income group (95th percentile), which is partly explained by the relatively large effects of inflation on financial income for those households.
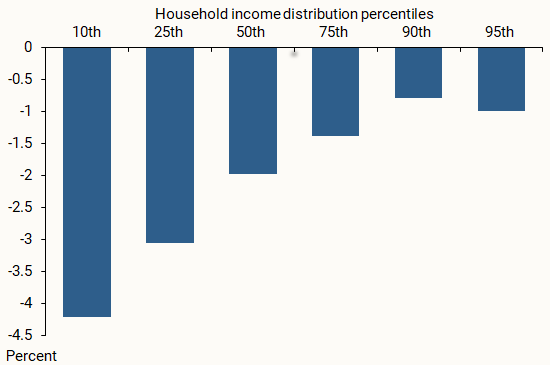
Most of the variation in total household income associated with unemployment fluctuations arises through variation in the main income component, labor earnings. Figure 3 shows the regression results for estimated changes in real household labor income (earnings) when the unemployment gap rises. Each percentile earnings measure reflects the average of the 10-percentile range around the indicated percentile of the distribution of total household income. For example, the earnings measure at the 10th percentile is the average earnings received by households whose total income places them between the 5th and 15th percentiles of that distribution.
Figure 3
Real earnings response to larger unemployment gap

Source: FRBSF calculations using CPS ASEC microdata (1968-2023) and corrected unemployment insurance benefits from Larrimore et al. (2022).
Figure 3 indicates that the estimated declines in earnings associated with increases in the unemployment gap generally are larger for households at lower percentiles of the income distribution. The large declines in earnings associated with higher unemployment among the lower percentiles (Figure 3) do not translate into large declines in household income (Figure 2, gold bars). In separate analysis, we confirmed that this offset of earnings losses arises due to government transfer payments, which are highly cyclically sensitive and very important for lower-income households, especially during the pandemic.
We extended our analysis to account for the duration of economic expansions. Past research, specifically Hines, Hoynes, and Krueger (2001) using data from 1976 to 2001, has found that long expansions produce improved economic outcomes. This is worth revisiting using updated data, especially given the long expansion that preceded the pandemic. To investigate this, we include in our regression analysis the duration of the contemporaneous economic expansion in years, in addition to changes in the unemployment gap and PCE inflation.
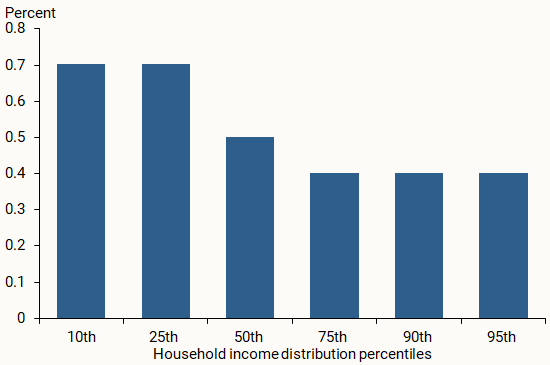
The results in Figure 4 show that real household income rises about 1/2 to 2/3 percentage point each year that an expansion continues, with larger effects evident at lower income percentiles. This suggests that household income is likely to continue growing across the board in the current expansion, even if unemployment and inflation are unchanged. The expansion before the pandemic lasted nearly 11 years. With the U.S. economy entering its fifth year of post-pandemic economic expansion, meaningful gains in real household income are likely if the expansion continues.
Figure 4
Real household income response to added expansion year

Source: FRBSF calculations using CPS ASEC microdata (1968-2023) and corrected unemployment insurance benefits from Larrimore et al. (2022).
Conclusion
Our analysis in this Letter shows that rising unemployment associated with business cycle downturns typically reduces households’ real income, as does higher inflation. The burden of these cyclical increases is significant and widely shared across most of the household income distribution. The pandemic period was an outlier relative to past patterns: Historically large government transfers via enhanced UI benefits largely offset the adverse effect of the surge in unemployment, especially in the lower half of the distribution of household income. Looking ahead, our findings show that meaningful gains in real household income are likely, especially at the lower end of the income distribution, if monetary policy and other factors continue to support a growing economy.
References
Aaronson, Stephanie R., Mary C. Daly, William L. Wascher, and David W. Wilcox. 2019. “Okun Revisited: Who Benefits Most from a Strong Economy?” Brookings Papers on Economic Activity, Spring 2019.
Bengali, Leila, and Evgeniya Duzhak. 2024. “How Do Periods of Inflation, Recession Affect Real Earnings?” FRBSF Economic Letter 2024-09 (April 1).
Blank, Rebecca M., and David Card. 1993. “Poverty, Income Distribution, and Growth: Are They Still Connected?” Brookings Papers on Economic Activity 2(1993), pp. 285–339.
Hines Jr., James R., Hilary W. Hoynes, and Alan B. Krueger. 2001. “Another Look at Whether a Rising Tide Lifts All Boats.” Chapter 10 in The Roaring Nineties: Can Full Employment Be Sustained?, eds. Alan B. Krueger and Robert M. Solow. New York: Russell Sage Foundation, pp. 493–537.
Larrimore, Jeff, Jacob Mortenson, and David Splinter. 2022. “Unemployment Insurance in Survey and Administrative Data.” Federal Reserve Board of Governors FEDS Notes, July 5.
Valletta, Robert G., and Mary Yilma. 2024. “Enhanced Unemployment Insurance Benefits in the United States during COVID-19: Equity and Efficiency.” FRB San Francisco Working Paper 2024-15, December (revised).
Opinions expressed in FRBSF Economic Letter do not necessarily reflect the views of the management of the Federal Reserve Bank of San Francisco or of the Board of Governors of the Federal Reserve System. This publication is edited by Anita Todd and Karen Barnes. Permission to reprint portions of articles or whole articles must be obtained in writing. Please send editorial comments and requests for reprint permission to research.library@sf.frb.org
