
Differences in prices for consumer goods and services across states have been increasing since the early 2010s. Those differences accelerated during the pandemic and the subsequent inflation surge. Higher-price states saw faster inflation from 2019 to 2022 compared with lower-price states, leading price levels to diverge further across regions. Data show that state-level inflation was driven by both goods and services, which tended to move together rather than independently in most regions.
Prices can vary substantially across different parts of the United States. Even though there are limited barriers to trade and movement between states, prices in some states persistently exceed those elsewhere. These differences can reflect various factors, including spending patterns. For example, households in warmer states may purchase different types of food or clothing than those in colder states. Price differences can also be influenced by transportation costs, such as the expense of shipping refrigerated foods across long distances, or location-specific services, such as higher hotel prices in tourist destinations. In addition, as Arnaut and Bengali (2023) highlight, prices of goods and services can respond differently to changes in the federal funds rate and other economic conditions.
Disparity in price levels—and changes in that disparity—can have implications for how the U.S. economy operates and how we understand it. Higher or increasing disparity across states might indicate changing barriers to trade that limit how well commerce can equalize prices. Price differences might affect how trade flows between states vary in response to unexpected changes in economic growth. Changes in price disparity means that states experience inflation differently, which could mean differences in the burden of inflation or how monetary policy might stabilize the economy. These variations also make it difficult for national-level data to accurately reflect each state’s experience.
In this Economic Letter, we document and analyze the increasing disparity in prices across states that began in the 2010s and continued through the pandemic and its aftermath. We trace the accelerated trend in price disparity during the pandemic back to regional variation in inflation. The pandemic and recovery had disparate impacts across states (Albert, Foerster, and Sarte 2021 and Foerster, Garvey, and Sarte 2021), and inflation dynamics likewise varied geographically. These differences in inflation exacerbated pre-existing price disparities: Many states with relatively higher price levels experienced more rapid inflation, while other states with relatively lower price levels experienced slower inflation.
Regional price-level disparities over time
We use Bureau of Economic Analysis (BEA) data on regional price parities (RPPs) to measure price differences across states. The BEA calculates RPPs using state-level data on prices and expenditures. RPP differences reflect differences across states both in the prices for the same items and for the different consumption baskets of goods and services across states. We use the BEA’s definitions to group states into eight regions: New England, Mideast, Great Lakes, Southeast, Plains, Southwest, Rocky Mountains, and West.
The RPPs are measured on an annual basis and indicate each state’s price level as a percentage of the national average that year. For example, the highest value in 2023 was California with an RPP of 112.6, meaning that California prices were 12.6% higher than the national average. Conversely, Arkansas had the lowest RPP of 86.5, so prices were 13.5% lower than the national average. The BEA reports all items RPPs for every state and the District of Columbia, with additional breakdowns for goods, housing, utilities, and all other services. Housing and utilities are well-documented drivers of price differences across states (Gascon and Fuller 2022). Therefore, we focus our analysis on three price level categories: all items, goods, and services excluding housing and utilities.
Figure 1 shows the standard deviation of RPPs across states from 2008 to 2023. This measure indicates the degree of price disparity across states, with higher standard deviations indicating a wider range of prices in that year. The variation in price levels for all items surpass those for goods and for services excluding housing and utilities, largely because it includes the substantial differences in housing and utility prices across states.
Figure 1
Variation in price levels across states over time
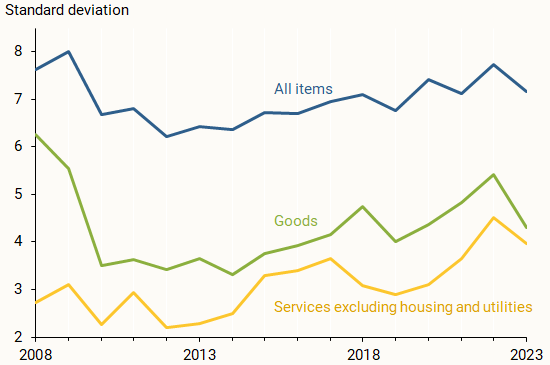
Overall price variation widened steadily during the period of relatively low inflation in the mid- to late 2010s and became even more pronounced as inflation increased during and after the pandemic before declining slightly in 2023.
Because RPPs are measured as percentages of the national average, a state with an RPP one standard deviation above average saw its price level rise from about 6% above the national average in 2013 to roughly 8% above in 2022. The price gap between states that were one standard deviation above and below average widened nearly 4 percentage points during this period, with half of that increase occurring from 2019 to 2022. This result implies that price differences when crossing state lines can exceed the typical annual inflation rate.
The separate RPPs for goods and for services excluding housing and utilities generally followed the same pattern over this period and likewise show meaningful increases. Although markets faced supply chain disruptions during the pandemic (Liu and Nguyen 2023)—which might have been expected to affect the flow of goods and hinder price equalization—the variation in goods prices never reached the earlier highs observed during the 2008 housing crisis. Similarly, disparities in prices for services gradually widened throughout the 2010s then increased sharply between 2019 and 2022. Both categories then moderated in 2023.
The geography of inflation variation
We use RPPs across states to quantify changes in state-level prices over time. Since RPPs track prices relative to the national average, we can combine them with U.S.-level personal consumption expenditures (PCE) inflation data to compute state-level inflation. For example, the United States had cumulative PCE inflation of just under 12.5% from 2019 to 2022 (3.1% per year). During the same time, California had above-average inflation of 13.6% (3.4% per year), while Arkansas had below-average inflation of 11.1% (2.8% per year).
The map in Figure 2 shows the change in each state’s prices from 2019 to 2022, with thick lines outlining the different BEA regions. States range from higher inflation, shaded in orange, through the national average in white, to lower inflation, shaded in blue. Darker shades indicate more substantial changes. The map highlights noticeable geographic variation, with above-average inflation in New England, the Southeast, and the West, and below-average inflation in the Mideast, Great Lakes, Plains, Southwest, and Rocky Mountain states.
Figure 2
Changes in state prices from 2019 to 2022

Source: Bureau of Economic Analysis.
Higher inflation increases price-level dispersion
The map in Figure 2 highlights where inflation was relatively higher or lower than the average. Figure 3 reveals whether these price changes occurred in states with already higher or lower price levels. The figure shows the relationship between relative price levels in 2019 (horizontal axis) and cumulative inflation from 2019 to 2022 (vertical axis). States with relatively high (low) pre-pandemic price levels are positioned toward the right (left); states with relatively high (low) 2019–2022 inflation are positioned toward the top (bottom). Each state is represented as a marker, with distinct shapes and colors to differentiate regions.
Figure 3
State RPPs in 2019 versus 2019-22 price changes
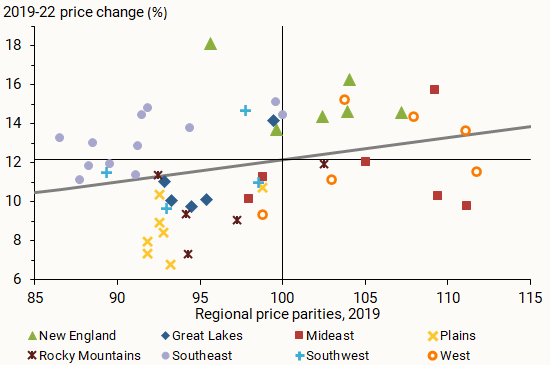
Source: Bureau of Economic Analysis, FRED, and authors’ calculations.
The distribution of markers shows notable differences across regions. The Plains states are concentrated in the lower left quadrant, indicating below-average price levels in 2019 and slower price growth from 2019–2022. Conversely, New England states cluster in the upper right quadrant, indicating relatively high pre-pandemic prices and high subsequent inflation. The picture is mixed for states in the West: Three of the six states—California, Oregon, and Washington—had above-average 2019 price levels and also experienced above-average inflation. The remaining three—Alaska, Hawaii, and Nevada—did not. The Southeast is notable for its concentration in the upper left quadrant, reflecting lower pre-pandemic prices and relatively high rates of price increases.
The distribution of states in Figure 3 sheds some light on what drove the increasing disparity in prices since 2019, documented in Figure 1. The upward-sloping gray regression line indicates that, on average, states with higher (lower) prices saw higher (lower) inflation. States in the lower left quadrant of Figure 3 (Great Lakes, Plains, Southwest, and Rocky Mountains) saw divergence of price levels from below; these states had relatively low prices that subsequently grew relatively slowly. Conversely, states in the upper right quadrant of Figure 3 (New England and some in the West), saw divergence of prices from above; these states had relatively high prices that subsequently grew relatively quickly. Both factors contributed to rising price disparity across states.
Was variation in regional inflation driven by goods or services?
To uncover the sources of price changes across states, Figure 4 plots a state’s goods inflation from 2019 to 2022 (horizontal axis) against its services inflation excluding housing and utilities over the same period (vertical axis). States with relatively higher (lower) inflation in goods are positioned further to the right (left); states that saw relatively higher (lower) inflation in services are positioned further to the top (bottom).
Figure 4
State price changes: Goods vs. services ex. housing, utilities
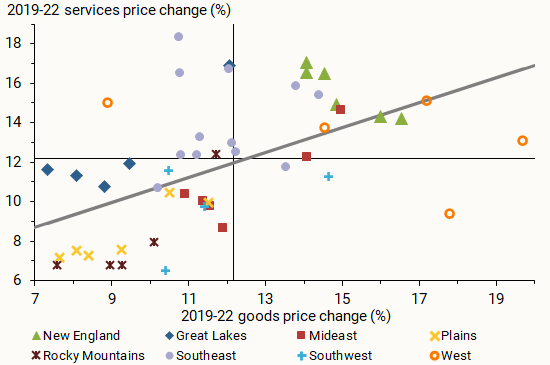
Source: Bureau of Economic Analysis, FRED, and authors’ calculations.
As with the overall changes in RPP and the price levels, Figure 4 shows notable differences in the pattern of goods and services inflation across regions. States in the Mideast, Plains, Southwest, and Rocky Mountains are generally clustered in the lower left quadrant, indicating that their relatively slow growth in overall prices came from low growth in both goods and services prices. New England, by contrast, is clustered in the upper right quadrant, reflecting high price growth in both goods and services. The Southeast shows high services inflation but less consistent growth in goods prices; this indicates the region’s relatively high inflation from 2019–22 tended to be driven more by services than goods prices.
These results indicate that the widening disparity in prices across states generally was driven by the price patterns of both goods and services. This is evident from the relative inflation in categories for each state tending to move together rather than independently, as shown in Figure 4.
Conclusion
Changing price disparities across states indicate that inflation does not hit all states equally, which has implications for both the costs of inflation and the impacts of monetary policy. Price disparities increased after the early 2010s and rose further during the pandemic and recent inflation surge. Focusing on the regional variation of price levels in the 2019 to 2022 period, this Letter shows how variation in relative inflation interacted with pre-pandemic price levels to create an increase in price-level disparity. However, after diverging over this period, state price levels converged somewhat in 2023. Going forward, it remains to be seen whether this convergence was a one-time change or the beginning of a trend that could help undo the divergence in state price levels from the previous decade.
References
Albert, Sarah, Andrew Foerster, and Pierre-Daniel Sarte. 2021. “Employment Effects of COVID-19 across States, Sectors.” FRBSF Economic Letter 2021-32 (November 22).
Arnaut, Zoë, and Leila Bengali. 2024. “How Quickly Do Prices Respond to Monetary Policy?” FRBSF Economic Letter 2024-10 (April 8).
Foerster, Andrew, Nick Garvey, and Pierre-Daniel Sarte. 2021. “Anatomy of a Pandemic Recovery Across Sectors and Regions.” Federal Reserve Bank of Richmond Economic Brief 21-40.
Gascon, Charles S., and Jack Fuller. 2022. “Variations in Inflation across U.S. Metro Areas.” Federal Reserve Bank of St. Louis Regional Economist, December 1.
Liu, Zheng, and Thuy Lan Nguyen. 2023. “Global Supply Chain Pressures and U.S. Inflation.” FRBSF Economic Letter 2023-14 (June 20).
Opinions expressed in FRBSF Economic Letter do not necessarily reflect the views of the management of the Federal Reserve Bank of San Francisco or of the Board of Governors of the Federal Reserve System. This publication is edited by Anita Todd and Karen Barnes. Permission to reprint portions of articles or whole articles must be obtained in writing. Please send editorial comments and requests for reprint permission to research.library@sf.frb.org