
The unemployment rate has risen over half a percentage point since the second quarter of 2023. Individual survey data underlying the unemployment rate can help in assessing which labor market transitions account for this rise. One dominant factor appears to be a fall in the job-finding rate—the share of unemployed individuals finding employment. The duration of unemployment has also increased recently. In past decades, these patterns have frequently occurred during the onset of recessions, which suggests that these data should be closely monitored.
The unemployment rate declined rapidly following the pandemic recession, dropping to 3.5% in the second quarter of 2023 before inching up to 4.1% in the fourth quarter of 2024. Is this uptick driven by workers losing their jobs and becoming unemployed or by job seekers unable to find employment? And how does this recent run-up in unemployment compare with past episodes?
In this Economic Letter, we consider these questions by analyzing worker flows between the labor market states of employment, unemployment, and out of the labor force (OLF). The transition rates between these states shed light on what factors might account for the recent rise in unemployment. We find that the recent increase in unemployment can be traced to a fall in the job-finding rate—the rate at which people transition from being unemployed to being employed. We also investigate unemployment duration—the length of time people stay unemployed—and find that it has risen noticeably.
Recent transition rates and unemployment duration patterns are similar to historical patterns around the onset of several past recessions. The increase in the unemployment rate since 2023 has mostly been associated with the decline in the job-finding rate, similar to pre-pandemic recessions. Consistent with this, we also find that the median duration of unemployment has increased notably.
The recent increase in the overall unemployment rate has been much more gradual than in pre-pandemic recession onsets. However, our findings suggest that unemployment flows—especially the job-finding rate—show a pattern qualitatively similar to past recession onsets and should be closely monitored for signs of rising recession risk.
The ins and outs of unemployment
The number of unemployed people in the economy in any given month is a sum of those who become newly unemployed—that is, those who transition into unemployment—and those who remain unemployed from the previous month—that is, those who have not transitioned out of unemployment. People can transition from employment into unemployment when they quit or lose a job. They also can move into unemployment from OLF when they start actively searching for a job. Similarly, people can exit unemployment to employment when they find a job or to OLF if they stop actively searching for a job.
At any point in time, changes in the unemployment rate are determined by transition rates between unemployment, employment, and OLF: employment-to-unemployment, OLF-to-unemployment, unemployment-to-employment, unemployment-to-OLF, employment-to-OLF, and OLF-to-employment (Shimer 2012). The transition rate between any two labor market states is calculated as the ratio of the number of people who move between those states to the number of people in the initial state. Using the methods of Hornstein and Kudlyak (2020), we construct transition rates from Current Population Survey microdata for January 1976 through December 2024.
In Figure 1, we examine the pattern of labor market transition rates over time, focusing on transitions between employment and unemployment. The job-separation rate from employment to unemployment is countercyclical: It reaches its cyclical low point just before the onset of recessions, increases during recessions, and then declines during cyclical recoveries. During the 2020 pandemic recession, the job-separation rate (blue line) increased dramatically, rising to almost five times its peak in the 2007–09 recession. In the aftermath of the pandemic recession, the separation rate reached its cyclical trough around the end of 2023 and has inched up since then.
Figure 1
Job-finding and job-separation rates
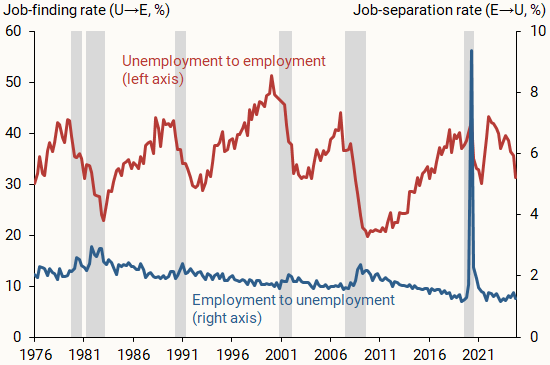
Source: Current Population Survey.
The job-finding rate, from unemployment to employment, is normally procyclical: It reaches its cyclical peak just before the onset of recessions, declines rapidly during recessions and reaches its cyclical trough, and then increases during recoveries. However, in the immediate aftermath of the 2020 recession, the job-finding rate differed from its historical pattern.
Job finding after the pandemic
Historically, the job-finding rate has tended to rise throughout expansion periods, only declining during recessions. In the expansion following the pandemic recession, this rate dropped much less than in previous recessions, then recovered briskly to its pre-pandemic level in the first quarter of 2022. In contrast to previous expansions, it then turned around in mid-2023 and has been declining since.
The pandemic recession differed from previous recessions partly because temporary layoffs played a large role in the sharp increase in unemployment (Hall and Kudlyak, 2022). This resulted in a brisk recovery: Unemployed workers on temporary layoff typically have a much higher job-finding rate than others, so when these workers are the majority of the unemployed, the job-finding rate rises quickly and, as they return to their jobs, unemployment recovers quickly.
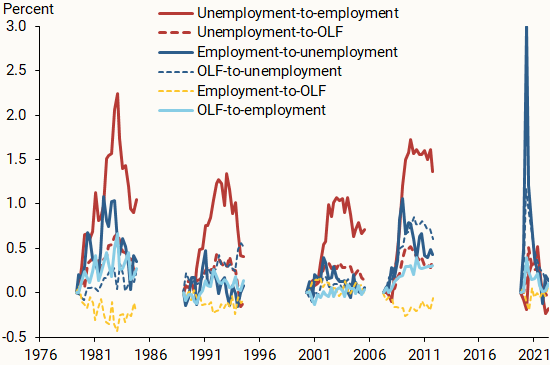
However, the recent decline in job finding is not driven by compositional changes involving layoffs. The ins and outs of unemployment after 2021 reflect the typical pre-pandemic mix of temporary layoffs and the rest of the unemployed. Specifically, although the share of temporary layoffs in total unemployment increased substantially during the pandemic, it subsided to its pre-pandemic levels by the end of 2021. Furthermore, following the pandemic, the job-finding rates of the temporarily laid off and the rest of the unemployed recovered and surpassed pre-pandemic levels, although both rates have declined in the past two years (Figure 2).
Figure 2
Job-finding rates

Source: Current Population Survey.
Flow rates and unemployment changes at the onset of recessions
To quantify the contribution of each of the flow rates to changes in unemployment, we use the relationship between the unemployment rate and the six transition rates. We construct a set of hypothetical unemployment rates by using the actual values for each specific transition rate while holding the remaining rates fixed.
Figure 3 shows the hypothetical unemployment rates based on the six transition rates from the start of each recession. For each recession, we identify the onset of the increase of the overall unemployment rate as the most recent quarter prior to or at the start of the recession as determined by the National Bureau of Economic Research (NBER), when the unemployment rate reaches its local minimum (see the chronology in Hall and Kudlyak 2022). For each recession episode, we depict the change of the hypothetical unemployment rate from the onset until eight quarters after its cyclical peak. These hypothetical measures can provide insights into how important each flow rate is in explaining changes in the unemployment rate—although they do not reveal what underlying economic forces could be driving the different flow rates.
Figure 3
Flow rate contributions to unemployment rate changes
Source: Current Population Survey.
The solid red and blue lines represent the changes in job-finding and job-separation rates from the onset of a recession, respectively. At the onset of recessions before the pandemic, changes in these two rates made up a large share of the unemployment rate increase. Particularly after the earliest months, our estimates suggest that the decline in the job-finding rate played the largest role, consistent with other research (Shimer 2012 and Elsby, Michaels, and Solon 2009). The flows from unemployment to OLF (dashed red lines) have also played a sizable role in recent recessions. The transition rate from employment to OLF (gold lines) has typically dragged the unemployment rate lower at the onset of a recession.
Understanding the recent increase in unemployment
Studying the contributions of each of the labor market transition rates to the recent increase in unemployment may provide context on the phase of the labor market in the business cycle. The second quarter of 2023 is the most recent quarter in which overall unemployment reached its local trough of 3.5%, and it inched up subsequently to 4.1% in the fourth quarter of 2024.
We calculate the change in the hypothetical unemployment rates due to changes in transition rates between those two quarters and find that the two largest changes come from the decline in the transition rates out of unemployment—to both employment (as the job-finding rate) and to OLF. Our hypothetical unemployment rate increased 0.30 percentage point (pp) based on the job-finding rate, 0.25 pp based on the transition rate from unemployment to OLF, 0.22 pp based on the transition rate from OLF to unemployment, 0.10 pp based on the transition rate from employment to unemployment, 0.09 pp based on the transition rate from out-of-the-labor-force to employment, and 0.04 pp based on the transition rate from employment to OLF.
Since the middle of 2024, the unemployment rate has stabilized at 4.0-4.1%. What transition rates can account for that? We find that the decline in the unemployment inflows, e.g., the job separation rate and the nonparticipation-to-unemployment rate, worked to counteract the effects of the decline of the unemployment outflow rates.
Another typical development is that unemployment duration or persistence increases as unemployment rises during typical recessions (Figure 4). Since mid-2022, the median unemployment duration has increased from 8 to 10.4 weeks. For comparison, unemployment duration reached 10 weeks in September 2008, in the middle of the 2007–09 recession.
Figure 4
Median unemployment duration
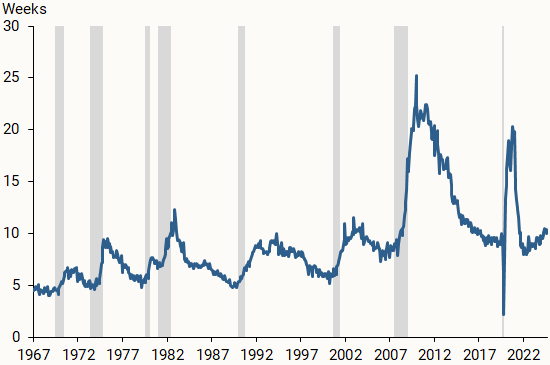
Source: Current Population Survey.
Finally, we compare the 0.6 pp increase in unemployment over the most recent six quarters—from the second quarter of 2023 to the fourth quarter of 2024—to the increase during the first six quarters in previous recession onsets: 1.7 pp at the onset of the 1981–82 recession, 1.6 pp at the onset of the 1990–91 recession, and 2.4 pp at the onset of the 2007–09 recession. The most recent increase is much more gradual than typical increases at the onset of past recessions.
Conclusion
In this Letter, we find that the recent increase in the unemployment rate has been driven by a decline in the job-finding rate and an increase in the persistence of unemployment for unemployed people. In the past, such patterns frequently occurred during the onset of recessions, suggesting that these developments could be signs of rising recession risk. Although the size of the recent increase in unemployment remains relatively small compared with past onsets, the recent data trends warrant close monitoring for potential signs of rising recession risk.
References
Elsby, Michael W.L., Ryan Michaels, and Gary Solon. 2009. “The Ins and Outs of Cyclical Unemployment.” American Economic Journal: Macroeconomics 1(1), pp. 84–110.
Hall, Robert E., and Marianna Kudlyak. 2022. “The Unemployed with Jobs and without Jobs.” Labour Economics 79(102244).
Hornstein, Andreas, and Marianna Kudlyak. 2020. “Why Is Current Unemployment So Low?” FRB San Francisco Working Paper 2020-05.
Shimer, Robert. 2012. “Reassessing the Ins and Outs of Unemployment.” Review of Economic Dynamics 15(2), pp. 127–148.
Opinions expressed in FRBSF Economic Letter do not necessarily reflect the views of the management of the Federal Reserve Bank of San Francisco or of the Board of Governors of the Federal Reserve System. This publication is edited by Anita Todd and Karen Barnes. Permission to reprint portions of articles or whole articles must be obtained in writing. Please send editorial comments and requests for reprint permission to research.library@sf.frb.org