Since the 1980s, decreasing interest rates have reduced the cost of financing for publicly traded corporations, which in turn has lowered their cost of capital by more than a third. Data show that their profits have likewise declined. At the same time, however, economy-wide corporate profits have increased substantially. Combining these data indicates that the increase in profits has instead gone to privately held companies. This implies that private companies have either increased their market power or their risk.
Profit rates for U.S. corporations started climbing slowly in the 1980s. Meanwhile, interest rates fell to historic lows, reducing the measured financing costs for corporations. This combination is unexpected. All else being equal, the gap between the interest rates that make up financing costs and the profit rates that reflect capital returns should narrow over time. When corporations can finance at low rates to invest in projects with high returns, it drives up the demand for low-cost capital in financial markets and drives down the supply of high-profit investment opportunities. Because the widening gap between costs and profits represents income that cannot be attributed to labor or capital, we call it the “profit puzzle.”
In this Economic Letter, we explain this profit puzzle. We argue that interest rates in financial markets only track the financing costs of publicly traded corporations, not privately held companies, in line with the adage “the stock market is not the economy.” To compare apples to apples, we compare these financing costs to profit rates for public corporations only. We find no puzzle for public corporations: Over the last 40 years, profit rates for publicly traded corporations have fallen, matching trends in interest rates. Meanwhile profits rates for privately held companies have increased substantially.
A historical view of the profit puzzle
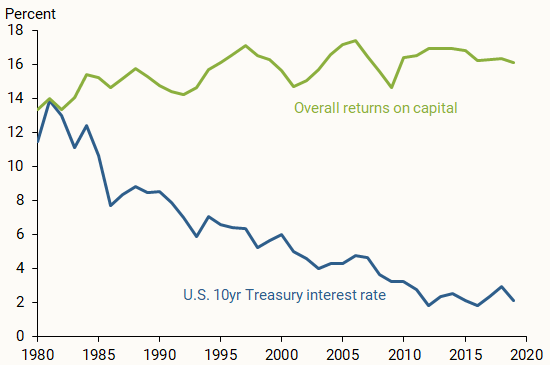
Investors require some payment to take on the risk of financing a company. From the company’s perspective, this payment is the cost of capital, a type of interest rate. The return on capital is the profit a company generates from that capital. Figure 1 displays the yield on 10-year U.S. Treasury securities, which approximates the interest rate, and the overall return on capital, or profit rate, over the last 40 years. Since 1980, these two series have diverged by more than 10 percentage points.
Figure 1
The profit puzzle between cost of capital and returns
Some argue this gap reflects declining competition, equivalent to rising market power. In a competitive economy, if a company attempts to significantly increase prices above their marginal production cost, a competitor can cut prices to increase their market share. By contrast, companies charging increasingly higher markups would be evidence of decreased competition and more concentrated market power, resulting in increasingly higher profit rates. This pattern would prevent the gap between costs and profits from closing.
Evidence of increasing markups is mixed. De Loecker, Eeckhout, and Unger (2020) argue that markups are rising. However, when accounting for marketing and management inputs (Traina 2018) or weighting companies by different measures of size (Edmond, Midrigan, and Xu 2023), trends in markups over the last 40 years are low or flat. When analyzing the divergence from past trends, researchers found profit rates above the cost of capital have increased from 13% in 1980 to 18% in 2018 (Barkai 2020). However, there is no clear pattern over the last 70 years (Karabarbounis and Neiman 2019). Additionally, these estimates suggest significant volatile movements and long periods of the cost of capital exceeding profit rates. Altogether, increasing market power alone cannot plausibly solve the profit puzzle.
Measuring markups and assessing competition in the overall economy requires cost and profit data from all companies. Data on privately traded companies are typically unavailable, so researchers must rely on bond and stock returns from publicly traded corporations to estimate a cost of capital for the entire economy. However, these estimates can introduce errors or bias into the data, which can lead to potentially large measurements of profits and markups. To accurately measure markups and evaluate competition, it is important to have a clean way to compare public, private, and overall capital costs and returns.
Public corporate profit rates have fallen
We use public-firm data from the CRSP/Compustat Merged Database (Compustat), a comprehensive database of publicly traded U.S. companies. We source economy-wide data from the Integrated Macroeconomic Accounts (IMAs), an interagency harmonization that combines data from the Bureau of Economic Analysis’s National Income and Product Accounts and the Federal Reserve Board Financial Accounts. For profits we use EBITDA (earnings before interest, taxes, depreciation, and amortization), a standard measure in financial economics and accounting. Notably, we focus on profits accruing to holders of both equity and debt.
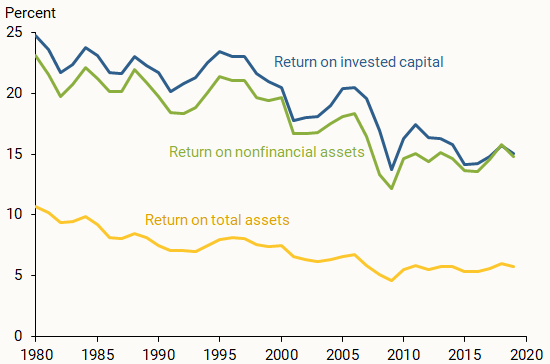
Profit rates for publicly traded firms have fallen by more than a third since 1980, in line with interest rate trends in financial markets. Figure 2 presents this drop across three alternative measures: the return on invested capital, measured as EBITDA divided by the total capital invested in a firm’s operations; the return on nonfinancial assets, EBITDA divided by the sum of inventories, net property, plant, and equipment, intangibles, and other long-term fixed assets; and the return on total assets, EBITDA divided by the sum of all assets. We focus on the first two measures because the third includes financial assets, which are on the balance sheets of firms invested in other firms, leading to a double counting that significantly underestimates overall profit rates.
Figure 2
Falling profit rates for publicly traded corporations
Accounting for differences between overall and public measures
Constructing similar data for private companies is more difficult because comprehensive data sets like Compustat do not exist. We instead rely on an indirect method, subtracting public corporation totals from overall totals to infer private company totals.
To compare returns for public and private firms, we must first correct for differences in the data from our two sources to make them easier to compare (see details in Davis, Sollaci, and Traina 2023). For instance, research and development spending is an expense in Compustat, but a capital investment in the IMAs. Without adjustment, both capital stocks and profits are skewed downward in Compustat. To build our public corporation cost of capital series, we also adjust for the differences in accounting rules, treatment of intangibles, depreciation, and tax rates between public and private firms.
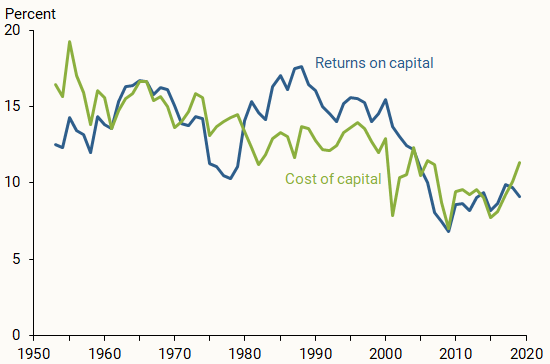
Figure 3 shows the capital returns and costs for public companies. The difference between these two series measures the market power of public corporations. The gap is narrow, implying market power is much smaller than commonly reported. This result emphasizes that, when comparing capital costs with capital returns for public corporations, there is no puzzle.
Figure 3
Capital returns and costs for publicly traded corporations
Implied private company profit rates have spiked
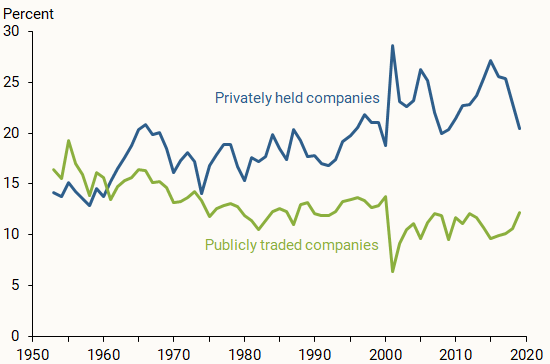
We next calculate the implied private company returns as a residual. The overall return on capital is a weighted sum of private and public corporate returns, with the weights determined by the respective capital shares. Since we know the returns on capital for public corporations and for the overall economy, and the share of capital owned by public corporations can be derived using data from Compustat and the IMAs, we can infer the return on capital for private companies.
Figure 4 highlights a clear difference between the public and evolving private corporate returns on capital. Although the two were similar before, private returns began to rise in the late 1970s and are now more than 50% higher. This shift is substantial, with private company returns surpassing public corporation returns by over 10 percentage points after 2000.
Figure 4
Estimated rise in capital returns for private companies
We cannot determine the compositional factors behind the rise in private company profits. They may operate in more profitable sectors or earn more profits within the same sectors as public firms or both, especially relative to the evolving composition of public corporations.
We test the validity of our findings by using alternate measures that exclude financial firms or firms incorporated outside the United States or use different weights based on domestic tax contributions. Public corporations are typically larger and more capital-intensive, more likely to have foreign investments, and more exposed to trade. Therefore, foreign activity could affect our trends if foreign profit rates have fallen more than domestic rates or if a larger share of economic activity has shifted to foreign locations where profits are lower.
Additionally, financial firms have a significant presence in public firm market indexes but are not included in the national account measures of economic activity. As a result, excluding financial firms in national account measures could introduce bias in our trend measures. After adjusting for both factors, we find that the decline in public corporate profits remains unchanged.
Why are private firms more profitable?
Our analysis suggests that private companies have been increasingly more profitable than public corporations in recent years. One potential reason is that private companies may gain some advantage through market power. Compared with public peers, private companies may face less competition, allowing them to raise prices and profit rates without increasing capital costs. Under this market power explanation, unmeasured private financing costs have not risen as steeply as profit rates.
An alternative reason relates to risk tolerance and investment strategies. Private companies may have a greater ability to justify risk because shareholders often pressure public corporations to maintain consistent returns. Private companies also have fewer federal regulations requiring monitoring, disclosure, and compliance, which might give them more flexibility to pursue riskier investments or strategies that yield higher returns over longer horizons. Greater risk tolerance would imply an increased cost of capital for private companies.
Conclusion
U.S. corporate profit rates have increased overall since the 1980s, alongside a decrease in interest rates. In this Letter, we explain how corporate returns continue to rise despite falling financing costs: while overall data track profits for all corporations, financing costs are based on data for public corporations only. Including private companies in comparisons with financial markets introduces bias because their investments can differ from public corporations and vary over time. By accounting for this bias, we demonstrate that profit rates for public corporations have declined while profit rates for private companies have increased.
Our findings support the idea that stock markets do not represent the overall economy. Stock market trends primarily reflect the performance of publicly traded companies, overlooking the broader spectrum of economic activity. Recognizing this disparity is crucial for gaining a nuanced understanding of economic dynamics and profit trends. Our analysis underscores the significant biases that may emerge when extrapolating trends from public firms to the entire economy.
References
Barkai, Simcha. 2020. “Declining Labor and Capital Shares.” Journal of Finance 75(5), pp. 2,421–2,463.
Davis, Carter, Alexandre Sollaci, and James Traina. 2023. “Profit Puzzles and the Fall of Public-Firm Profit Rates.” Kelley School of Business Research Paper 2021-42 (2023).
De Loecker, Jan, Jan Eeckhout, and Gabriel Unger. 2020. “The Rise of Market Power and the Macroeconomic Implications.” Quarterly Journal of Economics 135(2), pp. 561–644.
Edmond, Chris, Virgiliu Midrigan, and Daniel Yi Xu. 2023. “How Costly Are Markups?” Journal of Political Economy 131(7), pp. 1,619–1,675.
Karabarbounis, Loukas, and Brent Neiman. 2019. “Accounting for Factorless Income.” NBER Macroeconomics Annual 33, pp. 167–228.
Traina, James. 2018. “Is Aggregate Market Power Increasing? Production Trends Using Financial Statements.” Unpublished manuscript.
Opinions expressed in FRBSF Economic Letter do not necessarily reflect the views of the management of the Federal Reserve Bank of San Francisco or of the Board of Governors of the Federal Reserve System. This publication is edited by Anita Todd and Karen Barnes. Permission to reprint portions of articles or whole articles must be obtained in writing. Please send editorial comments and requests for reprint permission to research.library@sf.frb.org