
We’ve made a lot of progress in bringing down inflation, but there is more to do. We need to exhibit care and be ready to respond to however the economy evolves, balancing policy to protect full employment while restoring price stability. That is the economy we are striving for and working to deliver. The following is adapted from remarks presented by the president of the Federal Reserve Bank of San Francisco at the Commonwealth Club World Affairs of California, in partnership with the San Francisco Press Club, on June 24.
The last time I was here at the Commonwealth Club, the world looked considerably different. It was November 2021, and we were still struggling to come out of the pandemic. Inflation was high, the labor market was rebounding, and the federal funds rate, the Federal Reserve’s primary interest rate tool, was near zero.
Things have clearly changed. The federal funds rate is now above 5%, inflation has receded, although not completely, and the labor market has more than recovered and is now slowly moving towards a more sustainable level.
That’s a lot of improvement and we should acknowledge it. But we are not there yet. So, we must continue the work of fully restoring price stability without a painful disruption to the economy.
Today, I will review where we stand and discuss what it will take to finish the job (Board of Governors 2020).
Closing in
So, where are we? Well, we are still in the fight to bring inflation to our 2% goal. We’ve made a lot of progress, but there is still work to do.
As Figure 1 shows, since March of 2022, when the Federal Open Market Committee (FOMC) began raising interest rates, inflation has come down substantially, from a bit over 7% at its peak to just under 3% in the most recent readings. Importantly, as actual inflation has fallen, inflation expectations—what we all believe about the future—have followed suit, confirming that households, businesses, and markets know that the Federal Reserve is committed to reaching its inflation goal (Bundick and Smith 2024 and Powell 2024).
Figure 1
Inflation and unemployment since March 2022
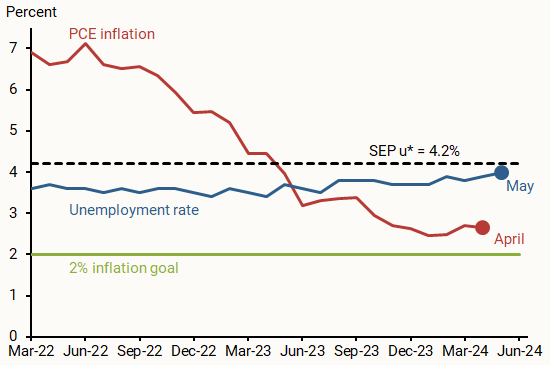
The decline in inflation owes to many factors, including improvements in supply chains, productivity, and labor force growth. These improvements include both goods and labor supply (Bernanke and Blanchard 2023, 2024; Guerrieri et al. 2023, and Shapiro 2024). Indeed, research by the San Francisco Fed shows that these supply factors were a key reason inflation fell, especially early in the period. In the 12 months following the first policy rate adjustment in March 2022, about two-thirds of the decline in overall personal consumption expenditures (PCE) inflation was from supply-driven inflation (based on the framework from Shapiro 2024). This share has fallen as demand factors have risen in importance.
As higher interest rates have taken hold, however, demand factors have become more important. Since the second half of last year, demand, rather than supply, has been the key driver of falling inflation. From March 2023 to April 2024, supply-driven inflation only accounted for one-fourth of the decline in overall PCE inflation.
Of course, as demand has slowed, so has the labor market. And this has translated into slightly higher unemployment, as the blue line indicates. So far, however, the rise in unemployment has been modest compared with the decline in inflation. The unemployment rate currently sits just below what many judge as its longer-run value, the level that reflects full employment. See the FOMC’s June 2024 Summary of Economic Projections (SEP).
In other words, so far, so good. Both supply and demand have contributed to the decline in inflation. And progress has come without a significant disruption to the labor market.
Monetary policy is working, but we need to finish the job. And this will take balance.
Balanced goals
The bumpiness of inflation data so far this year has not inspired confidence. Research offers many reasons why progress on reducing inflation might be uneven. These include: the long and variable lags of the effects of monetary policy on economic activity (Dupor 2023 and Bengali and Arnaut 2024); changes in the relative importance of persistent versus transitory shocks to inflation (Stock and Watson 2007, Lansing 2022, Almuzara, Kocaoglu, and Sbordone 2023); and changes in the slope of the Phillips curve that governs the responsiveness of inflation to changes in economic slack (Ball, Leigh, and Mishra 2022, Harding, Lindé, and Trabandt 2023, Benigno and Eggertsson 2023, and Crust, Lansing, and Petrosky-Nadeau 2023). Recent readings are more encouraging, but it is hard to know if we are truly on track to sustainable price stability.
And we can’t count on all the supply factors that helped us last year. Now that supply chains are largely mended, and domestic labor force participation has fully recovered, we are unlikely to get as much help from those forces. We have to remain open to positive supply developments, but increasingly, restrained demand, rather than improved supply, will likely be needed to get inflation down to goal.
And that brings the labor market into the conversation. As I showed earlier, so far, the labor market has adjusted slowly, and the unemployment rate has only edged up. But we are getting nearer to a point where that benign outcome could be less likely.
Although job growth remains strong, most other measures of labor market conditions have returned to their pre-pandemic levels. In particular, the balance between the demand and supply of workers has largely normalized.
An easy way to see this is in something called the Beveridge curve (Figure 2), a curve that’s received a lot of attention of late. It captures the relationship between job vacancies (demand for workers) and unemployment (supply of workers) (updated from Bok et al. 2022).
Figure 2
Beveridge curve: Unemployment and job vacancies
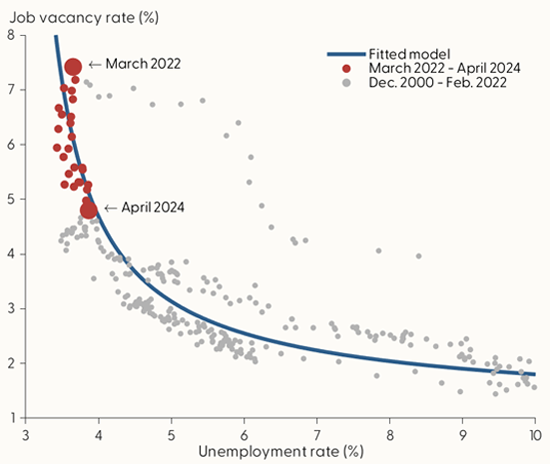
The blue line in the figure is the historical path of the curve. The model is fitted on January 1999 through February 2020 data. The dots show the history in gray and the more recent experience in red.
Looking at the top of the red dots, you can see that, in the aftermath of pandemic lockdowns, firms posted historically large numbers of job vacancies. Firms were scrambling, if you remember, trying to manage hiring and turnover to meet ever-surging consumer demand. Vacancies rose rapidly, firms chased a limited pool of workers, and the labor market felt frenzied. In Beveridge curve terms, we moved up the steep portion of the curve.
Then, as interest rates rose and things became less frenzied, vacancies reversed. Firms settled down, posted fewer jobs, and we moved back down the Beveridge curve. All of this occurred without a significant increase in unemployment—as shown by the lower red dots. (The possibility of this adjustment via vacancy reductions rather than unemployment increases was discussed in Figura and Waller 2022 and Bok et al. 2022). At this point, we have a good labor market, but not a frothy one.
Going forward, this tradeoff may not be as favorable. The latest job market data, the large red dot for April 2024 shows that we are getting very near the flatter portion of the Beveridge curve. This means that future labor market slowing could translate into higher unemployment, as firms need to adjust not just vacancies but actual jobs. Moreover, the economy may also be moving onto a flatter portion of the Phillips curve, implying it will take a larger upward movement in labor market slack to achieve further downward movements in the inflation rate. (See Ball, Leigh, and Mishra 2022, Harding, Lindé, and Trabandt 2023, Benigno and Eggertsson 2023, Crust, Lansing, and Petrosky-Nadeau 2023, and Furman 2024.)
All this is to say that at this point, inflation is not the only risk we face. We will need to keep our eyes on both sides of our mandate—inflation and full employment—as we work to achieve our goals.
Scenario planning
So, what does this mean for policy? Simply put, we need to be vigilant and open.
We have two goals, one tool, and a lot of uncertainty. So, being definitive and predetermined is not that helpful.
What is helpful is planning. Evaluating scenarios that could play out and understanding how policy should respond.
In other words, to be appropriate, policy has to be conditional. And we have to think in scenarios.
For example, if inflation turns out to fall more slowly than projected, then holding the federal funds rate higher for longer would be appropriate. If instead, inflation falls rapidly, or the labor market softens more than expected, then lowering the policy rate would be necessary. Finally, if we continue to see gradual declines in inflation and a slow rebalancing in the labor market, then we can normalize policy over time, as many expect.
The truth is any of these scenarios are in the realm of reasonable—they are all possible. And we need to be ready to respond to however the economy evolves.
People want both
Let me end where I started. This is not 2021, or 2022, or even 2023. We are in a very different place. Inflation has come down, the labor market is solid, and businesses and households believe that we can finish the job.
But we’re not there yet.
Whether you call it the final mile, completing the work, or simply delivering fully on our dual mandate goals, there is more to do.
But we will need to exhibit care. To really thrive, people need both price stability and jobs.
I know this from my own experience. I grew up in Ballwin, Missouri, in the 1970s, the last period of high inflation. In my world, many people struggled. Inflation imposed a corrosive tax, eroding earnings, making it hard to pay bills or invest in anything other than the day-to-day. Worst of all, there was no end in sight. Inflation expectations in advance of the Volcker disinflation were unanchored, moving up nearly one-to-one with actual inflation. This tight connection meant inflation was self-reinforcing, hence there was no end in sight. (See Daly 2022 for discussion.)
The Volcker disinflation remedied that. But the medicine was harsh. And my family, and millions of other American families, went from being constrained by high inflation to hampered by job loss.
Looking back, that medicine seemed necessary, reflecting the specific circumstances of the time.
But we are not in that world. The Federal Reserve has credibility that it didn’t back then. As noted earlier, longer-run inflation expectations are well-anchored. People know the Fed will bring inflation down.
All of this means that our journey today can be different. Not just avoiding a painful recession, but balancing policy to protect full employment while restoring price stability.
That is the economy we are striving for, and that is the one we are working to deliver.
References
Almuzara, Martin, Babur Kocaoglu, and Argia Sbordone. 2023. “Where Is Inflation Persistence Coming From?” Liberty Street Economics, Federal Reserve Bank of New York, July 6.
Ball, Laurence, Daniel Leigh, and Prachi Mishra. 2022. “Understanding U.S. Inflation During the COVID Era.” Brookings Papers on Economic Activity (Fall), pp. 1–54.
Bengali, Leila, and Zoë Arnaut. 2024. “How Quickly Do Prices Respond to Monetary Policy?” FRBSF Economic Letter 2024-10 (April 8).
Benigno, Pierpaolo, and Gauti B. Eggertsson. 2023. “It’s Baaack: The Surge in Inflation in the 2020s and the Return of the Non-Linear Phillips Curve.” NBER Working Paper 31197, April.
Bernanke, Ben S., and Olivier Blanchard. 2023. “What Caused the U.S. Pandemic-Era Inflation?” Petersen Institute for International Economics Working Paper 23-4, June.
Bernanke, Ben S., and Olivier J. Blanchard. 2024. “An Analysis of Pandemic-Era Inflation in 11 Economies.” NBER Working Paper 32532, May.
Board of Governors of the Federal Reserve System. 2020. “Review of Monetary Policy Strategy, Tools, and Communications: 2020 Statement on Longer-Run Goals and Monetary Policy Strategy.” Adopted effective January 24, 2012; as amended effective August 27, 2020.
Bok, Brandyn, Nicolas Petrosky-Nadeau, Robert G. Valletta, and Mary Yilma. 2022. “Finding a Soft Landing along the Beveridge Curve.” FRBSF Economic Letter 2022-24 (August 29).
Bundick, Brent, and A. Lee Smith. 2024. “Despite High Inflation, Longer-Term Inflation Expectations Remain Well Anchored.” Federal Reserve Bank of Kansas City Economic Bulletin (May 31).
Crust, Erin E., Kevin J. Lansing, and Nicolas Petrosky-Nadeau. 2023. “Reducing Inflation along a Nonlinear Phillips Curve.” FRBSF Economic Letter 2023-17 (July 10).
Daly, Mary C. 2022. “This Time is Different…Because We Are.” FRBSF Economic Letter 2022-05 (February 28).
Dupor, Bill. 2023. “Examining Long and Variable Lags in Monetary Policy.” Federal Reserve Bank of St. Louis Regional Economist (May 24).
Figura, Andrew, and Chris Waller. 2022. “What Does the Beveridge Curve Tell Us About the Likelihood of a Soft Landing?” Federal Reserve Board of Governors FEDS Notes, July 29.
Furman, Jason. 2024. “The Fed Can Take Its Time Taming Inflation.” Commentary, Wall Street Journal, June 16.
Guerrieri, Veronica, Michala Marcussen, Lucrezia Reichlin, and Silvana Tenreyro. 2023. Geneva 26: The Art and Science of Patience: Relative Prices and Inflation. London: CEPR Press
Harding, Martín, Jesper Lindé, and Mathias Trabandt. 2023. “Understanding Post-COVID Inflation Dynamics.” Journal of Monetary Economics 140, pp. S101–S118.
Lansing, Kevin J. 2022. “Untangling Persistent versus Transitory Shocks to Inflation.” FRBSF Economic Letter 2022-13 (May 23).
Powell, Jerome. 2024. “June 11-12, 2024 FOMC Meeting Press Conference.” June 12.
Shapiro, Adam Hale. 2024. “Decomposing Supply and Demand Driven Inflation.” Forthcoming in Journal of Money, Credit, and Banking, available as Federal Reserve Bank of San Francisco Working Paper 2022-18.
Stock, James H. and Mark W. Watson. 2007. “Why Has Inflation Become Harder to Forecast?” Journal of Money, Credit, and Banking 39, pp. 3–34.
Opinions expressed in FRBSF Economic Letter do not necessarily reflect the views of the management of the Federal Reserve Bank of San Francisco or of the Board of Governors of the Federal Reserve System. This publication is edited by Anita Todd and Karen Barnes. Permission to reprint portions of articles or whole articles must be obtained in writing. Please send editorial comments and requests for reprint permission to research.library@sf.frb.org