
The Congressional Budget Office recently raised its demographic projections for net U.S. immigration. Most of the increase in the projections came from undocumented immigrants. Updating the CBO estimates with recent data points shows a continuing strong inflow of undocumented migrants. Analysis linking the revised estimates for this group to labor market statistics shows that immigrants joining the workforce are likely to have modestly eased labor market tightness.
Update as of November 21, 2024 in SF Fed Blog
The Congressional Budget Office (CBO) substantially revised its estimates of annual net immigration—the number of people who enter the United States net of those who leave each year—relative to the previous report. The CBO now projects that 3.3 million people on net immigrated to the United States in both 2023 and 2024. These estimates are each about 2 million people higher than the past year’s estimates, mostly driven by higher estimates of undocumented immigrants. Overall, recent net immigration numbers are substantially higher than the pre-pandemic trend. During the 2010s, net immigration averaged below 1 million people and was mostly driven by holders of green cards and work and student visas.
This Economic Letter relies on the CBO’s methodology to update its estimates and infer the likely impact on U.S. labor markets. My findings suggest that an additional 1.3 million undocumented immigrants entered the United States between October 2023 and January 2024, exceeding estimated flows for similar time periods in previous years. Using state variation in court cases related to immigration, I find that this strong migration inflow eased labor market tightness, as measured by a reduction in the job vacancy-to-unemployment (V–U) ratio. This occurs through two channels. Some new migrants entered the labor force and likely filled job openings, which reduces vacancies (V). Conversely, some of the migrants, being new to the labor market, are likely to be unemployed (U), which increases the U in the V–U ratio. Offsetting these channels, migrants add to consumer spending, which expands the U.S. economy and thus vacancies. Overall, my estimates suggest that around one-fifth of the easing of labor market tightness in 2023 can be attributed to the spike in immigration. Given the delays in migrants transitioning to the labor force, further declines in the V–U ratio are likely this year.
CBO’s methodology and inflow of undocumented migrants
The CBO is the first agency to highlight the number of undercounted immigrants during the post-pandemic surge. The American Community Survey and Current Population Survey (CPS) conducted by the Census Bureau and the Bureau of Labor Statistics (BLS) reported notably lower numbers for the foreign-born population. As a case in point, Figure 1 shows that the CBO revised estimates for recent net international migration (NIM) are about three times larger than the Census estimates.
Figure 1
Net international migration projections by agency
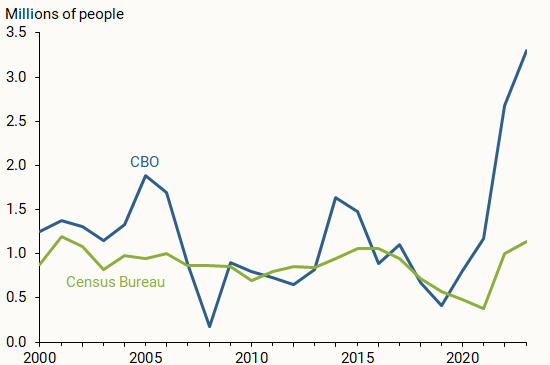
The post-pandemic increase in NIM has not been reflected in Census data for two main reasons. First, Census estimates are based on the previous year’s survey data, making it less receptive to sudden changes in population. Second, the Census Bureau tends to undercount undocumented immigrants due to their housing situations. Many of the uncounted U.S. migrants live in group-style quarters or buildings with multiple housing units near the Mexico border (Brown et al. 2023). Additionally, the CBO’s methodology points to a decline in survey response rates that leads to undercounting foreign-born populations in surveys.
The differences in NIM estimates are amplified by an unusually high number of undocumented migrants. To demonstrate how net flows of different migrant categories have changed over the years, Figure 2 plots CBO projections of overall U.S. population growth (dark blue line) and breaks it down into natural increase, defined as domestic births net of deaths (green bars), and two NIM components: visa and green card holders (yellow bars), and undocumented migrants (light blue bars).
Figure 2
Demographic contributions to population growth
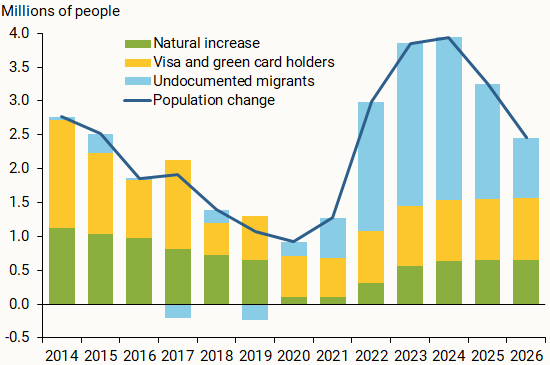
The visa and green card holders component is relatively stable over time, which is partly due to the capacity constraints of U.S. Citizenship and Immigration Services. Furthermore, this category is projected to have a limited contribution in the near future. Net immigration of undocumented migrants, on the other hand, shows both substantial changes over time and a sizable contribution to recent and future population growth. Projections suggest it will contribute over 70% to overall NIM flows between 2022 and 2024.
Given the outsized importance of this category, I use the CBO’s methodology to calculate the inflow of undocumented migrants and update these numbers, using the most recent data from the Department of Homeland Security (DHS).
Undocumented migrants
The CBO estimates net immigration of undocumented migrants using DHS data and testimonies, then subtracts CBO model estimates of those who either emigrated or had a status adjustment. The inflow of people in the undocumented category surged in recent years, fueling the overall growth in NIM. Before 2019, the inflow of undocumented migrants averaged well below 1 million people. In 2022, however, the inflow exceeded 2 million people, followed by over 3 million migrants in 2023.
Figure 3 depicts the four groups making up the growth in the inflow of undocumented migrants. The first group includes migrants who arrive at official points of entry (POE, green bars), usually relying on immigration parole or demonstration of a credible fear and desire to apply for asylum to gain legal admission to the country. The share of migrants that arrived at POE in 2023 was much larger than in 2022 mostly due to the extension of the humanitarian parole that motivated more people to use legal pathways.
Figure 3
Undocumented migrant inflows

Source: Department of Homeland Security and author’s calculations.
People arriving between official POE (dark blue bars) includes migrants who attempt to enter the United States unlawfully and encounter Border Patrol. This group represents apprehended individuals who demonstrate evidence of credible fear and are released with a Notice to Appear while waiting for their case to be heard by an immigration court. This is one of the largest categories driving the recent surge in undocumented migrants. The third group is undetected migrants (yellow bars), which includes people who also enter unlawfully between POE but evade Border Patrol. This group is the second largest contributor in recent years and includes both individuals observed by Border Patrol but not apprehended and those not observed by Border Patrol. The DHS estimates these numbers using a repeated trials model methodology (Bailey et al. 2016).
The last group represents people with a temporary visa who overstay their visa duration (light blue bars). While this category made up a larger share of undocumented migrants in the past, its share has dropped relative to the other three categories in recent years.
Following the CBO’s methodology, I use newly released DHS data to estimate the inflow of undocumented migrants for the first four months of fiscal year 2024 beginning in October 2023. I assume the same rate of visa overstays and unlawful entrants as in 2023. The estimate, presented in the last bar of Figure 3, already exceeds the annual numbers typically encountered before the pandemic. Annualizing the numbers as of January produces an estimate of 3.8 million for fiscal year 2024.
Impact on the U.S. labor market
A high NIM volume directly feeds into the labor force by increasing the number of people available to work. For some migrants within the undocumented category, transition to the labor force is delayed because they need to obtain work authorization, which can take many months.
In late 2022 and early 2023, the United States expanded the use of humanitarian parole for people coming from countries in turmoil, including Cuba, Haiti, Ukraine, and Nicaragua (640,000 people as of December 2023) and extended temporary protected status to Venezuelans (472,000 people) who were in the United States before July 31, 2023. People in those categories are immediately eligible for work permits, although processing those permits took a median of nine months in 2022. Hence, one can assume that these immigrants started getting authorizations between late 2023 and early 2024 and are expected to continue to enter the labor force throughout 2024.
Census and BLS data are likely to undercount the recent immigration spike’s contribution to the labor force and employment, particularly due to a higher volume of undocumented crossings. Therefore, to study the effect of immigration on the degree of labor market tightness, I estimate the V–U ratio (Barnichon and Shapiro 2022). This method assumes that changes in vacancies and unemployed individuals reflect changes in labor demand and worker availability, hence labor market tightness. I conduct this analysis at the state level.
Regional labor market response to immigration
Immigrant inflows vary by region. Some states attract more immigrants and therefore have a different response in the local V–U ratio. I use this regional variation to estimate the sensitivity of labor market tightness to changes in immigration.
State NIM estimates by the Census Bureau are likely underestimating the net flow of immigrants in the past few years due to the unusually high share of undocumented migrants. Therefore, instead of NIM, I use data for new cases in state immigration courts and proxy for the regional flow of migrants by using court cases for undocumented individuals without admission or parole.
According to the data, Florida, New York, Texas, and California received the highest volume of new cases in both 2022 and 2023. In per capita terms, Louisiana, Massachusetts, Utah, and Colorado were also among the highest for new immigration court filings.
The dashed line in Figure 4 demonstrates that states that experienced higher per capita volumes of undocumented immigrants in 2023 broadly had a lower V–U ratio in the first few months of 2024. It is worth noting that V–U ratios in some of these states declined to close to 1, indicating a relatively balanced labor market.
Figure 4
New immigration court cases and V–U ratio by state
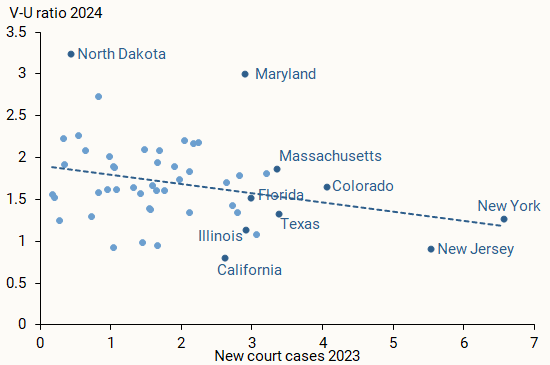
To quantify the impact of the higher volume of migrants on labor market tightness, I use state data from 2021–2024 and estimate the relationship between relative changes in the number of new immigration court cases and relative changes in the V–U ratio. The results imply that a 100% increase (doubling) in the number of new immigration court cases in the prior year is associated with a 16% decrease in the V–U ratio.* The average change in the number of court cases was 85% across states, with some of the larger increases in Illinois (202% increase), Maine (179%), and Colorado (144%). While this simple model does not control for other contributing factors, the effect is broadly in line with an estimate using national NIM data and the model described in Duzhak (2023). The results suggest that about one-fifth of the V–U decline was associated with higher immigration.
Conclusion
Recent data released by the CBO suggest an unusually high level of net international migration. The source of the recent increase is a higher flow of undocumented migrants and foreign nationals who overstay their visas. The strong migration flow has eased regional labor market tightness, as measured by the vacancy-to-unemployment (V–U) ratio. Given the delays in migrants transitioning to the labor force and updated estimates pointing to a continuing strong inflow of migrants, further declines in the V–U ratio are likely in 2024.
*Corrected from “16% increase” to “16% decrease” on August 29, 2024.
References
Bailey, John W., et al. 2016. “Assessing Southern Border Security.” Institute for Defense Analyses Paper NS P-5304, May.
Barnichon, Regis, and Adam Shapiro. 2022. “What’s the Best Measure of Economic Slack?” FRBSF Economic Letter 2022-04 (February 22).
Brown, J. David, Misty L. Heggeness, and Marta Murray-Close. 2023. “Noncitizen Coverage and Its Effects on U.S. Population Statistics.” Center for Economic Studies Working Paper CES-23-42, August.
Congressional Budget Office. 2024. The Demographic Outlook: 2024 to 2054. Report, January 18.
Duzhak, Evgeniya. 2023. “The Role of Immigration in U.S. Labor Market Tightness.” FRBSF Economic Letter 2023-06 (February 27).
Opinions expressed in FRBSF Economic Letter do not necessarily reflect the views of the management of the Federal Reserve Bank of San Francisco or of the Board of Governors of the Federal Reserve System. This publication is edited by Anita Todd and Karen Barnes. Permission to reprint portions of articles or whole articles must be obtained in writing. Please send editorial comments and requests for reprint permission to research.library@sf.frb.org