


Households accumulated more liquid assets beginning in 2020 than would have been expected without the pandemic. These “extra” liquid assets have dissipated, but their evolution has differed significantly by income group. While middle- and lower-income households hold substantially less liquid wealth than implied by pre-pandemic projections, the level for higher-income households remains close to its pre-pandemic path. Over the same period, credit card delinquency rates initially dropped and, more recently, have steadily risen as pandemic-era liquid wealth was depleted, especially for middle- and lower-income households.
Consumer spending has remained surprisingly resilient over the past two years in the face of higher interest rates. In an earlier study (Abdelrahman, Oliveira, and Shapiro 2024), we showed that the continued strength in consumer spending could be partially explained by the large amount of wealth that households built up following the onset of the pandemic recession. In this Economic Letter, we dig deeper to assess the link between consumer spending and wealth by income group.
We track how liquid wealth—the asset class most easily converted to consumer spending—evolved during the post-pandemic period and how it exceeded expectations compared with a “no-pandemic” scenario. This measure of “pandemic-era wealth” quantifies the additional liquid assets accumulated by households due to pandemic-related changes in government income support and personal consumption decisions.
We assess the evolution of pandemic-era liquid wealth across two income groups: high income and middle to low income. We find that households in both income groups accumulated and subsequently spent large amounts of liquid wealth following the onset of the pandemic recession. The rise and fall in household liquid wealth coincided with a fall and subsequent rise in credit card delinquency rates for both groups.
Higher-income households held pandemic-era liquid wealth until mid-2022, and credit card delinquencies started to increase above pre-pandemic levels shortly thereafter. These households recently increased their liquid asset holdings by shifting funds into money market funds, likely fueled by higher interest rates. Middle- and low-income households spent down their entire pandemic-era liquid wealth a bit earlier, by late 2021. Similar to high-income households, credit card delinquency rates for middle- and low-income households surpassed pre-pandemic levels around the same time they completely drew down their pandemic-era liquid wealth. However, delinquency rates for this group grew more substantially and more rapidly than high-income households and now sit about 3 percentage points above late-2019 levels.
Top income group gained more wealth
The average American household stores more than two-thirds of its overall wealth in financial assets such as savings accounts, stocks, and pension plans and about one-third in nonfinancial assets such as real estate. Higher-income households store a larger share of their wealth in financial assets than the average household, while middle- and lower-income households store a higher share of their wealth in nonfinancial assets, particularly the value of their homes.
We focus on a particular subset of financial assets collectively referred to as liquid wealth because they can more quickly and easily fund household spending. Liquid wealth includes cash, checking and savings deposits, and money market funds. These asset classes make up about 10% of overall wealth for households across the income distribution.
Figure 1 shows the evolution of liquid assets for the top 20% and bottom 80% of households by income, according to the Federal Reserve’s Distributional Financial Accounts. We chose this dividing line because the trends across households at different levels of the income distribution within the bottom 80% group are largely similar in the data and, more importantly, because they are distinct from the trends for the top 20% of households by income. Similar to other types of assets, a disproportionately large share of liquid assets is held by high-income individuals. Although the bottom 80% represents four times as many households, this group holds only half as much liquid wealth as the top 20%.
Figure 1
Real household liquid wealth vs. “no-pandemic” estimates
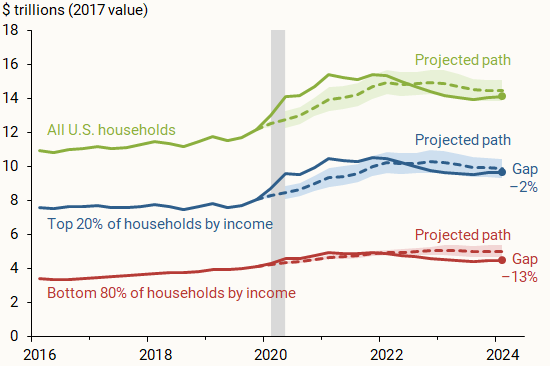
Source: Federal Reserve Board of Governors and authors’ calculations.
We focus on “real” liquid assets, adjusting for inflation by dividing all assets by the price index for personal consumption expenditures and expressing wealth levels in 2017 U.S. dollars. This adjustment for inflation keeps household purchasing power fixed over the 2016–2024 sample period. We compare the evolution of actual real household liquid wealth (solid lines) with hypothetical “no-pandemic” scenarios (dashed lines). Using the local projections method of Jordà (2005), we estimate out-of-sample projections separately for the two distinct groups and for households overall by using data only up to the fourth quarter of 2019—just before the start of the pandemic recession in the first quarter of 2020.
Following the onset of the pandemic, households across the income distribution saw a rapid increase in their liquid asset holdings, well above what would have been expected in the absence of the pandemic shock. We refer to the difference between the actual path (solid line) and hypothetical path (dashed line) as pandemic-era liquid wealth.
The large increase in liquid wealth was most pronounced for higher-income households. By early 2021, the top U.S. households by income had 11% more liquid assets, equaling $1.1 trillion more than would have been implied by the pre-pandemic projection. By contrast, holdings by middle- and lower-income households in the bottom 80% peaked at an additional 6%, or $270 billion, of liquid holdings. Households across the income distribution saw their pandemic-era wealth decline by the second quarter of 2021, indicating that they began spending the additional funds they accumulated earlier in the pandemic period. Our estimates suggest that middle- and lower-income households spent all of their pandemic-era liquid wealth by late 2021, while higher-income households’ extra funds lasted until the second half of 2022. The latest estimates through the first quarter of this year indicate that the current level of liquid wealth that higher-income households hold is just below the pre-pandemic projection (–2%), while the level for middle- and lower-income households is significantly below projection (–13%).
Divergent paths for money market funds
To better understand the divergence in liquid wealth between households across the income distribution, we look next at the evolution of its components. The trends we find across income groups for overall liquid assets are largely the same ones we observe for cash and bank deposits. However, an interesting difference emerges for money market funds—interest-bearing pooled investments that typically focus on short-term safe assets.
Figure 2 shows how much money each income group held in money market funds in recent years. This category is relatively small, making up one-fourth of total liquid wealth for higher-income households and slightly over one-eighth for middle- to lower-income households.
Figure 2
Money market fund holdings by income groups
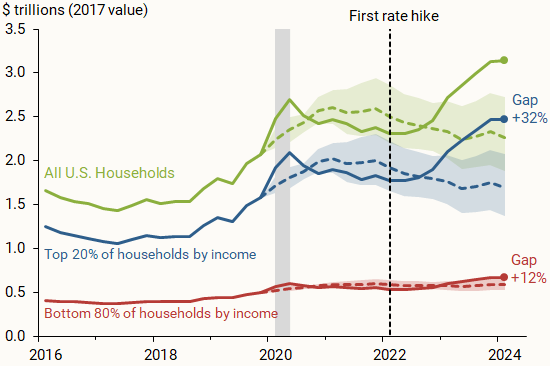
Source: Federal Reserve Board of Governors and authors’ calculations.
Money market fund holdings began increasing in 2022 as interest rates were rising. They saw a large spike in early 2023, as households looked for higher yields than many traditional checking and savings accounts offered at the time (Ensign 2023). This trend is especially true for the top households by income, whose investments in money market funds have grown to more than 30% above what would have been expected in the absence of the pandemic. Thus, part of the reason liquid assets stopped declining after 2022 for higher-income households was the rise in interest rates, which likely encouraged larger holdings in money market funds.
Weaker financial conditions for households
The recent drawdown in liquid assets has coincided with an increase in household debt, which has been steadily increasing over the past few years—and recently reached all-time highs, according to the Household Debt and Credit Report by the Federal Reserve Bank of New York (2024).
Figure 3 incorporates data on delinquency rates for borrowers living in high-income and low- to middle-income neighborhoods from the Federal Reserve Bank of New York’s Equifax Consumer Credit Panel. The two panels in Figure 3 focus on accounts that are marked as seriously delinquent and compare delinquency rates (right side scales) and pandemic-era liquid wealth (left side scales) to their late-2019 levels. The division of households into two income groups varies slightly between the liquid wealth and delinquency rate series due to differences in how each data set is constructed.
Figure 3
Credit card delinquencies and pandemic-era liquid assets
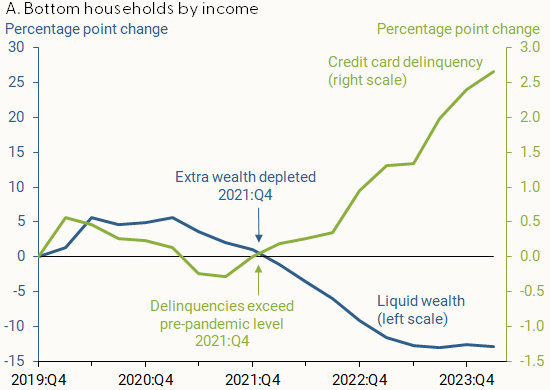

Source: Federal Reserve Board of Governors, Federal Reserve Bank of New York Consumer Credit Panel/Equifax, and authors’ calculations.
While credit card delinquencies currently sit above pre-pandemic levels for households across all income groups, middle- and lower-income households (panel A) crossed this threshold about four quarters earlier than higher-income households (panel B). In addition, the share of borrowers with seriously delinquent credit card debt is notably higher for the bottom households by income than for the top households by income. Households in the bottom income group currently have higher credit utilization rates and significantly smaller cushions in the face of financial downturns than other income groups (Haughwout, et al. 2024, Abecasis 2024).
Conclusion
In this Letter, we examine household liquid wealth across income groups since the pandemic recession and find a large increase and subsequent decline in real pandemic-era liquid wealth. The large increase in liquid wealth was most pronounced for higher-income households and was primarily driven by a significant buildup of cash and bank deposits. Higher-income households also invested more heavily in money market funds starting in 2023.
Depleted household liquid wealth was accompanied by a notable increase in credit card delinquency rates, particularly for middle- and lower-income households. Smaller financial cushions and heightened credit stress for households at the bottom 80% of the income distribution pose a risk to future consumer spending growth.
References
Abdelrahman, Hamza, Luiz Edgard Oliveira, and Adam Shapiro. 2024. “The Rise and Fall of Pandemic Excess Wealth.” FRBSF Economic Letter 2024-06 (February 26).
Abecasis, Manuel. 2024. “How Healthy Are Household Finances?” U.S. Economic Analyst, Goldman Sachs Global Research Group. June 24.
Ensign, Rachel Louise. 2023. “Rich Customers Pull Money from Banks Offering Paltry Interest Rates.” Wall Street Journal. January 24.
Federal Reserve Bank of New York. 2024. “Household Debt Rose by $184 Billion in Q1 2024; Delinquency Transition Rates Increased Across All Debt Types.” FRB New York Press Release (May 14).
Haughwout, Andrew F., Donghoon Lee, Daniel Mangrum, Joelle Scally, Wilbert van der Klaauw, and Crystal Wang. 2024. “Delinquency Is Increasingly in the Cards for Maxed Out Borrowers.” Liberty Street Economics, FRB New York. May 14.
Jordà, Òscar. 2005. “Estimation and Inference of Impulse Responses by Local Projections.” American Economic Review 95(1), pp. 161–182.
Opinions expressed in FRBSF Economic Letter do not necessarily reflect the views of the management of the Federal Reserve Bank of San Francisco or of the Board of Governors of the Federal Reserve System. This publication is edited by Anita Todd and Karen Barnes. Permission to reprint portions of articles or whole articles must be obtained in writing. Please send editorial comments and requests for reprint permission to research.library@sf.frb.org