Consumers’ perceptions of labor market conditions have historically aligned closely with the unemployment rate. However, the two diverged during the pandemic, when the unemployment rate spiked while people’s views of the labor market remained more positive. This raises the question of whether public perceptions around the labor market have become untethered from the data. Measuring labor market conditions using the jobless unemployment rate, which excludes temporary layoffs, suggests this is not the case: the historical link between people’s perceptions and measured labor market conditions has remained strong.
At any point in time, individuals can be working, losing jobs, or finding jobs and have some estimates about their own labor market prospects. However, it is less clear whether the general public has a good understanding of aggregate labor market conditions. To examine this question, in this Economic Letter, we look at measures of labor market perceptions from the Conference Board’s Consumer Confidence Survey. We find that survey responses align well with the aggregate unemployment rate in the pre-pandemic period. For more than a year during the pandemic, however, people perceived the labor market as being much healthier than the high unemployment rate implied.
One reason for this change may be that total unemployment did not adequately capture labor market tightness because of the surge in temporary layoffs during the pandemic. To account for this, we use the jobless unemployment rate, which captures data on people who are unemployed for reasons other than temporary layoffs, as a measure of labor market tightness. We find that the relationship between consumer labor market perceptions and labor market tightness remained largely intact during the pandemic.
Our finding suggests that, in general, the public correctly perceives the health of the aggregate labor market. An important implication is that consumer survey data—which are available closer to real time than official government data such as the monthly unemployment rate—can be useful for tracking the health of the labor market. Most recently, consumer perceptions about the strength of the labor market reached their cyclical peak in March 2022. As of June 2024, consumer perceptions have returned to their pre-pandemic relationship with the unemployment rate, and both signal the same degree of the labor market strength.
Consumer perceptions of labor market conditions
Our consumer perceptions data come from the Consumer Confidence Survey conducted monthly by the Conference Board since 1977. The survey has been conducted online through four weekly waves each month since May 2021, surveying approximately 3,000 individuals (Conference Board 2021).
Consumers are surveyed regarding the labor market before the official unemployment rate for the month is published. The Conference Board releases survey results on the final Tuesday of each month, including preliminary data for the contemporaneous month and finalized data for the previous month. The Bureau of Labor Statistics (BLS) typically publishes unemployment rates for a specific month on the first Friday of the following month (BLS 2020). As such, preliminary data on consumer confidence are available a few days before the official unemployment rate.
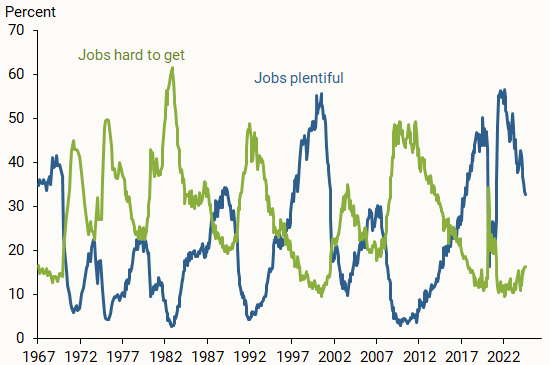
In this Letter, we analyze finalized data from June 1977 through July 2024 and preliminary data for August 2024. We use two survey questions that report individuals’ perceptions surrounding current employment conditions: the share of consumers that says jobs are plentiful and the share that says jobs are hard to get (Figure 1). The share of consumers that says jobs are plentiful is low when the labor market is weak and high when the labor market is strong. Over the period from June 1977 to December 2019, the series’ correlation with the unemployment rate was –0.85. The series for those saying jobs were hard to get moves in the opposite direction, with a correlation of –0.91 with unemployment.
Figure 1
Consumer perceptions about job availability

Consumer perceptions and the unemployment rate
To construct a single index for labor market perceptions (LMP), we follow Weidner and Williams (2011) in combining the two series on consumer perceptions for job availability. The index can range from 0 to 100, with a high value associated with a strong labor market. Weidner and Williams (2011) document that their labor market perceptions index has been closely related to measures of labor market tightness.
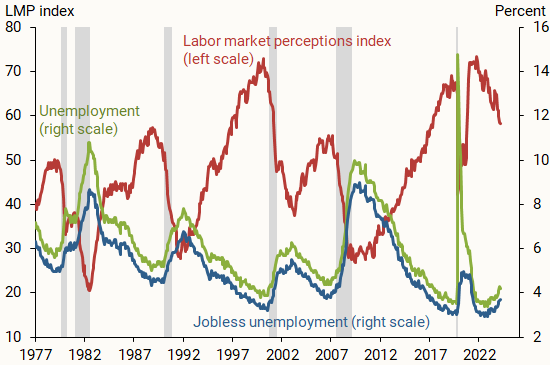
Figure 2 shows a close relationship between the LMP index (red line) and the unemployment rate (green line), especially before the pandemic, with a correlation of –0.92. In particular, we observe a distinct pattern of comovement entering and exiting recessions, shown by the gray shading. At the onset of a recession, the LMP index rapidly falls as the unemployment rate quickly rises. Following a recession, the LMP index slowly rises, while the unemployment rate slowly falls.
Figure 2
Labor market perceptions and unemployment rates

Source: Conference Board, Bureau of Labor Statistics, and author’s calculations.
During the pandemic recession, the LMP index plummeted from 64.6 in March 2020 to 42.2 by May 2020, before starting to recover. The index reached its cyclical peak of 73.6 in March 2022, while the unemployment rate reached its most recent low of 3.4% in April 2023.
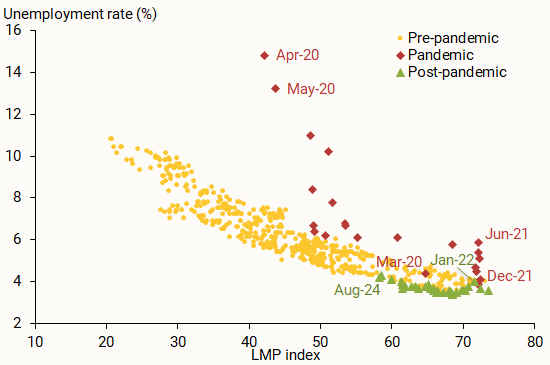
Figure 3 more closely examines the relationship between the LMP index on the horizontal axis and the official unemployment rate on the vertical axis. We separate the observations into three periods: the pre-pandemic period from June 1977 through February 2020 (gold dots), the pandemic period from March 2020 through December 2021 (red diamonds), and the post-pandemic period, January 2022 through August 2024 (green triangles). Figure 3 shows that before the pandemic, there was a tight downward-sloping relationship between the unemployment rate and the LMP index (gold dots). That is, higher values of the LMP index are associated with lower unemployment rates.
Figure 3
Labor market perceptions and unemployment

After February 2020 and into 2021, the historical relationship between the unemployment rate and the LMP index broke down. Consumers perceived the labor market as being in better shape than the unemployment rate indicated. Specifically, between March and April 2020, unemployment jumped up outside its historical range. This caused the April 2020 observation to appear well above other observations. While unemployment climbed to historic highs, the LMP remained in the middle of its historical range. Thereafter, unemployment continued to fall while the LMP continued to improve. Between June and December 2021, the unemployment rate was falling faster than its historical pace. Meanwhile, the LMP lingered near its peak level for that period. This is indicated by the almost vertical cloud of red diamonds in the bottom right corner. Overall, the observations from April 2020 to December 2021 indicate that the unemployment rate during that period was above its historical values, and the unemployment rate was higher for any level of the LMP index than the historical relationship would have predicted.
Since January 2022, the post-pandemic relationship between the unemployment rate and the LMP index appears to be back to its pre-pandemic association (green triangles). Recently, the unemployment rate has been slowly increasing while the LMP index has been slowly decreasing, in sync with their historic relationship.
Consumer perceptions and the jobless unemployment rate
An important feature of the pandemic recession was that the entire run-up of unemployment between March and April 2020 came from temporary layoffs (Kudlyak and Wolcott 2020). Hall and Kudlyak (2020) show that, to understand the labor market during the pandemic and its aftermath, one should examine temporary-layoff unemployment separately from unemployment due to other reasons, known as jobless unemployment. Unemployed workers on temporary layoff typically wait to be called back to their jobs, while those listed as jobless unemployed go through a time-consuming search and matching process to find jobs. Hall and Kudlyak (2020) show that the jobless unemployment rate better captures labor market tightness than the official unemployment rate.
We include the jobless unemployment rate series in Figure 2 (blue line) for comparison. During the pandemic, the unemployment rate reached its peak of 14.7% in April 2020. In contrast, the jobless unemployment rate was slowly rising through 2020 and reached its peak of 4.9% in November 2020.
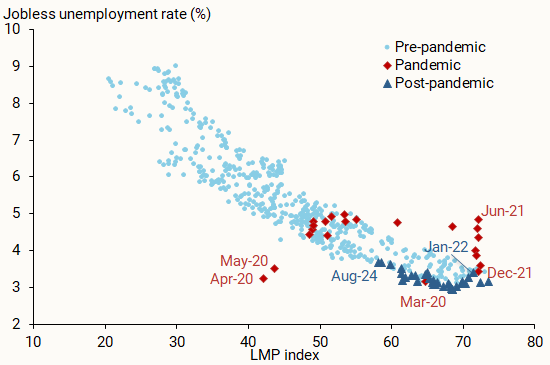
Examining the relation between the LMP index and the jobless unemployment rate in Figure 2 shows that the jobless portion made up most of the unemployment rate before the pandemic. Therefore, given the tight pre-pandemic relation between LMP and overall unemployment, it is not surprising that the relationship between LMP and the jobless unemployment rate was also tight and negatively sloping, depicted by the light blue dots in Figure 4.
Figure 4
Labor market perceptions and jobless unemployment

Between March and April 2020, the jobless unemployment rate did not change noticeably from its lowest historical point, while the LMP index decreased. However, the data points for these two months (red diamonds) are much closer to the historical cloud of light blue points than the official unemployment rate was in Figure 3.
After May 2020, the red data points generally lay close to the historical relationship between the LMP index and the jobless unemployment rate. This is in stark contrast to the relationship between the official unemployment rate and the LMP index during the same period. Given the observed level of the LMP index, the total unemployment rate indicated an excessively slack labor market for over a year, whereas the jobless unemployment rate suggested an overly tight labor market for just two months, based on their respective historical correlations with the LMP index. Finally, during the most recent period (dark blue triangles), the jobless unemployment rate has been rising slightly while the LMP has been declining, in line with the historical pattern.
In sum, labor market perceptions appear to align more closely with the jobless unemployment rate than with the official unemployment rate. This is consistent with earlier research arguing that the jobless unemployment rate is a more accurate measure of overall labor market conditions (Hall and Kudlyak 2022).
It is also worth noting that Kudlyak and Miskanic (2024) find that businesses perceived the labor market as being tighter than did consumers during much of the post-pandemic period. However, data from June through August 2024 suggest the relation between consumer and business perceptions has returned to its pre-pandemic pattern.
Conclusion
In this Letter, we find that consumers are aware of aggregate labor market conditions. Consumer labor market perceptions have historically had a close relationship with the official unemployment rate. During the pandemic, that relationship broke down for more than a year, with people’s perceptions signaling a much tighter labor market than implied by the official unemployment rate. This was also a period when temporarily laid-off workers made up a large share of the unemployed. Our analysis suggests that consumer labor market perceptions are better aligned with the jobless unemployment rate as a measure of overall labor market conditions. An important implication of our finding is that survey data from consumer labor market perceptions—which are available sooner than unemployment data—can provide a useful understanding of the current state of the labor market.
References
Bureau of Labor Statistics. 2020. “Frequently Asked Questions: The Impact of the Coronavirus (COVID-19) Pandemic on The Employment Situation for April 2020.”
Conference Board. 2021. “Consumer Confidence Survey Technical Note – May 2021.”
Hall, Robert E., and Marianna Kudlyak. 2022. “The Unemployed With Jobs and Without Jobs.” Labour Economics 79(102244).
Kudlyak, Marianna, and Erin Wolcott. 2020. “Pandemic Layoffs.” Working Paper, Middlebury College.
Kudlyak, Marianna, and Brandon Miskanic. 2024. “Consumer and Firm Perceptions of the Aggregate Labor Market Conditions.” FRB San Francisco Working Paper 2024-28.
Weidner, Justin, and John C. Williams. 2011. “What Is the New Normal Unemployment Rate?” FRBSF Economic Letter 2011-05 (February 14).
Opinions expressed in FRBSF Economic Letter do not necessarily reflect the views of the management of the Federal Reserve Bank of San Francisco or of the Board of Governors of the Federal Reserve System. This publication is edited by Anita Todd and Karen Barnes. Permission to reprint portions of articles or whole articles must be obtained in writing. Please send editorial comments and requests for reprint permission to research.library@sf.frb.org
