Shelter costs are one of the largest expenses for most households and an important component of overall inflation. It is therefore important to understand why shelter costs have remained stubbornly high. A key explanation is that, especially since the pandemic, demand for housing has been growing faster than new units have come into the market. Using the gap between the demand for and supply of housing along with other leading indicators of shelter prices can help assess whether shelter inflation will continue on a path toward historically normal levels.
Shelter costs reflect how much tenants and homeowners living in their residence pay for housing services. Not surprisingly, shelter costs represent one of the largest expenses that households face and therefore receive a large weight in the construction of the consumer price index (CPI). For example, July 2024 data showed that shelter services contributed 2.2 percentage points to a core CPI reading of 3.2% on a 12-month basis, excluding volatile energy and food prices.
In constructing the CPI, the Bureau of Labor Statistics (BLS) regularly measures shelter costs—also called rents—for tenants by using data on new rents and by calculating rents of existing lease agreements; for owners, the BLS estimates what they would have to pay if they had to rent their own home. The data suggest that shelter inflation has responded sluggishly to higher interest rates, as previously noted in Liu and Pepper (2023) and Arnaüt and Bengali (2024).
The basic logic of monetary policy suggests that when interest rates go up, demand slows and prices come down. However, the supply of housing also declines when interest rates go up. For example, higher interest rates feed into higher construction costs, primarily through financing costs, and therefore lower the returns from the lease of newly constructed units. This means higher interest rates can place opposing forces on rents—creating a tension between lower supply and lower demand for housing. Lease agreements are also negotiated less frequently than the prices of other goods and services. On net, rental prices eventually slow down, but they do so more gradually than prices of other goods and services whose supply is less sensitive to interest rates.
In this Letter, we consider different leading indicators of shelter inflation, particularly units under construction and the gap between completed units and net household formation to assess the evolution of future rent inflation. These two, along with market rents for new lease agreements, tend to foreshadow shelter inflation by about one year. Taken together, these measures suggest that shelter inflation will continue to decline toward more traditional levels over the next year.
Excess demand in the housing market
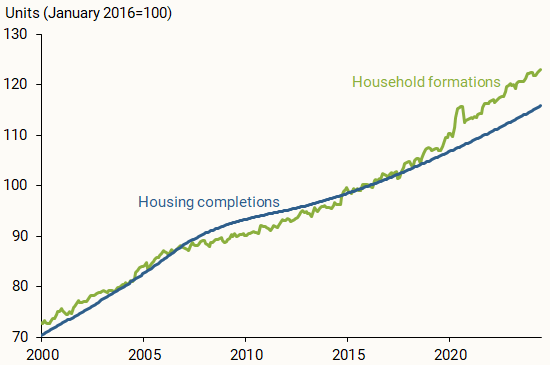
To examine supply and demand in housing markets, we start with the Census Bureau’s Housing Vacancy Survey, which provides monthly information on net household formation. The change in cumulated net household formation can be interpreted as a reasonable proxy measure of housing demand. The survey also provides data on the new housing supply through a measure of cumulative new privately owned housing units that have been completed. The gap between these two series provides information on the stock of housing relative to demand. The bigger the gap, the more demand exceeds supply, making it more difficult for rents to come down. Figure 1 shows the evolution of these two series since the year 2000, with both series normalized to equal 100 in January 2016, to highlight how the series diverge before and after that point.
Figure 1
Housing completions relative to household formations

The figure reveals several interesting features. Early in the sample, household formations (green line) and new housing units completed and coming to market (blue line) grew at a similar pace. The Global Financial Crisis saw the creation of new households slow down relative to completions. Paciorek (2016) argued that this was due to an aging population, higher shelter costs, and the cyclical effects of higher unemployment rates during the crisis. The headship rate—that is, the number of household heads relative to the adult population—fell, which is consistent with the slowing in household formations, as shown in Figure 1.
Leading up to the COVID-19 pandemic and with the financial crisis in the rearview mirror, household formation and completions growth began to equalize in the mid-2010s. However, since the pandemic, a considerable gap between demand and supply of housing emerged that has likely put upward pressure on rents. This gap between household formation and units completed provides a good barometer for where rents might be headed, as noted by Daly (2024).
Other leading indicators of shelter inflation
Two other indicators prove useful in thinking about where shelter inflation is headed. We noted that an imbalance in supply and demand for housing should be reflected in asking rents. It is therefore natural to consider how much additional housing supply is expected to come online in the near future and to examine how asking rents for new leases are expected to change.
The Census Bureau provides data on new residential construction units in various stages, including those authorized by building permits, authorized but not started, started, and under construction. We find the last category to be particularly useful because it is a good indicator of units that will come online within a 12-month period. The more units available, the less pressure on rents.
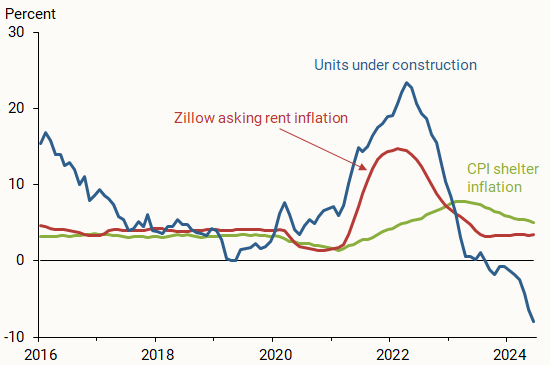
Figure 2 presents the evolution of the growth rate in residential units under construction relative to shelter inflation measured by the CPI and relative to asking rents on new leases. The figure shows that when asking rents for new leases shot up during the pandemic (red line), builders also reacted and new units under construction shot up (blue line).
Figure 2
CPI shelter inflation, Zillow rents & units under construction

Source: Bureau of Labor Statistics, Census Bureau, and Zillow.com.
An important component when the BLS calculates CPI shelter services inflation (green line) is owners’ equivalent rent (OER). OER represents about three-fourths of the weight when calculating shelter inflation. It is based on a large survey across locations and structure types. The BLS uses this information to impute rents for owner-occupied homes by using market rents of homes with similar characteristics. Another component of shelter inflation is rents by existing tenants, which often reflect longer duration lease agreements.
However, to understand where rents might be headed, it is useful to focus on a third component, asking rents on new lease agreements. These new tenant rents offer a window into how lease renewals and OER imputation may be adjusted in the coming months. The BLS recently started providing a quarterly index on new tenant rents. This index measures prices renters would face if they changed housing units every period.
In closely related calculations that generated similar results, Lansing, Oliveira, and Shapiro (2022) found that data available from Zillow on asking rents provide a smoother and more up-to-date view on where rents might be headed. This in part reflects that asking rents are not subject to the contractual and legal rigidities of existing rents and are therefore more responsive to underlying economic conditions. Fluctuations in asking rents from Zillow are echoed about a year later in shelter inflation. This makes it another good candidate to understand how shelter inflation may evolve over the next 12 months.
Rent inflation is expected to slow down
Using data on the gap between new household formation and units completed, new units under construction, and Zillow data on asking rents, we construct a model to forecast shelter inflation. The model also includes information on past values of shelter inflation to account for inflation momentum, core CPI inflation to get a sense of prices in other sectors that may affect shelter inflation, the unemployment rate to account for its effects on household formation, and the federal funds rate, which factors into building costs. We restrict the estimation sample to data observed before the pandemic, from January 2016 to February 2020, to prevent the forecast model from being overly affected by the unusual behavior of the economy during the pandemic while still accounting for patterns evident just before the pandemic started.
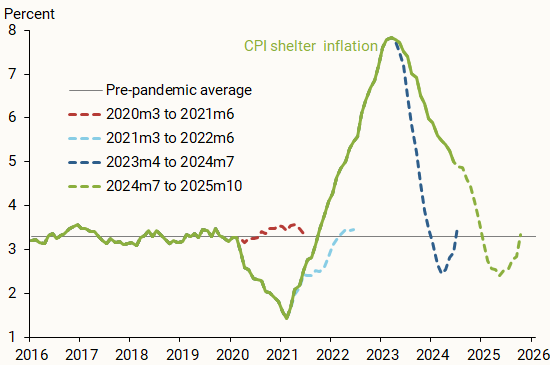
We evaluate the performance of our model with three experiments, generating 16-month-ahead forecasts at three different points in time that use only data available before each forecast start date. Figure 3 shows the actual data on shelter inflation (solid green line) along with forecasts at each of three dates, shown as dashed lines. In the first experiment, we produce an out-of-sample forecast starting in March 2020 to June 2021 (dashed red line). The model, along with everyone else, did not anticipate that a pandemic would hit the world economy in the spring of 2020 and therefore predicts that shelter inflation would have remained around the level experienced before the pandemic. This is a good check that the model does not suffer from look-ahead bias.
Figure 3
CPI shelter inflation with model projections

In the second experiment, we produce a 16-month-ahead forecast starting in March 2021, when shelter inflation dipped below 2% (dashed light blue line). The idea is to see whether the model would have predicted continued declines in shelter inflation, which would reveal that the model is being driven primarily by momentum, or whether the model can detect a turning point in inflation. The results confirm that the model would have predicted shelter inflation to turn around and begin increasing, albeit at a slower pace than what turned out to be the case.
The third experiment focuses on the peak of shelter inflation in March 2023 (dashed dark blue line). Again, if the model were solely based on the momentum of inflation, we would expect to see its forecasts continue to rise. Instead, the model predicts a rapid decline, steeper than we have observed since but very much in the same direction.
These three experiments confirm that, while far from perfect, our model can capture the broad contours of shelter inflation. Hence, we put our model to work and ask, what does it predict over the next 16 months?
The model forecasts that shelter inflation will continue to decline (dashed green line), perhaps as low as 2% by the end of this year, before recovering to the pre-pandemic average of 3.3% by spring 2025. Given the large misses shown in the forecasts for previous periods, however, we place more emphasis on the direction of the forecast than on the specific numerical predictions or the time frame for returning to the prior average.
Conclusion
Shelter inflation, an important component of core CPI inflation, has been slowing down in recent months. Using a model that takes advantage of measures of the balance in the supply and demand of housing, we project that shelter inflation will continue to decline over the next few months. This will contribute downward pressure to inflation overall, although the extent and speed of this adjustment in shelter inflation is highly uncertain.
References
Arnaüt, Zöe, and Leila Bengali. 2024. “How Quickly Do Prices Respond to Monetary Policy?” FRBSF Economic Letter 2024-10 (April 8).
Daly, Mary C. 2024. “Home Truths: Changing the Conversation on Housing.” Remarks presented at the 2024 National Interagency Community Reinvestment Conference, Portland, OR, March 6.
Lansing, Kevin J., Luiz E. Oliveira, and Adam H. Shapiro. 2022. “Will Rising Rents Push Up Future Inflation?” FRBSF Economic Letter 2022-03 (February 14).
Liu, Zheng, and Mollie Pepper. 2023. “Can Monetary Policy Tame Rent Inflation?” FRBSF Economic Letter, 2023-04, (February 13).
Paciorek, Andrew. 2016. “The Long and the Short of Household Formation.” Real Estate Economics 44(1), pp.7–40.
Opinions expressed in FRBSF Economic Letter do not necessarily reflect the views of the management of the Federal Reserve Bank of San Francisco or of the Board of Governors of the Federal Reserve System. This publication is edited by Anita Todd and Karen Barnes. Permission to reprint portions of articles or whole articles must be obtained in writing. Please send editorial comments and requests for reprint permission to research.library@sf.frb.org
