The COVID-19 inflation surge experienced abroad undoubtedly left its mark on U.S. inflation. As global economies return to business as usual, it is natural to ask whether international considerations continue to affect U.S. inflation. Recent analysis shows that, although in normal times the international component of U.S. inflation is usually small, at other times it can contribute significantly to U.S. inflation dynamics.
Inflation rose and fell similarly across many countries during the COVID-19 pandemic. This global comovement of inflation rates is neither new nor specific to the pandemic. Several researchers have noted that inflation rates across the globe are gradually converging with one another; see, for example, Jordà, Marti, Nechio, and Tallman (2019). Moreover, Auer, Pedemonte, and Schoenle (2024) recently provided evidence that supports an international component of inflation that is linked primarily to country-level integration in global value chains, among other factors.
In this Economic Letter, we assess the contribution of such an international component to U.S. inflation dynamics. Our findings suggest that, while U.S. inflation is mostly driven by domestic factors, the role of international forces can influence changes in inflation by as much as 1 to 2 percentage points.
The international inflation component
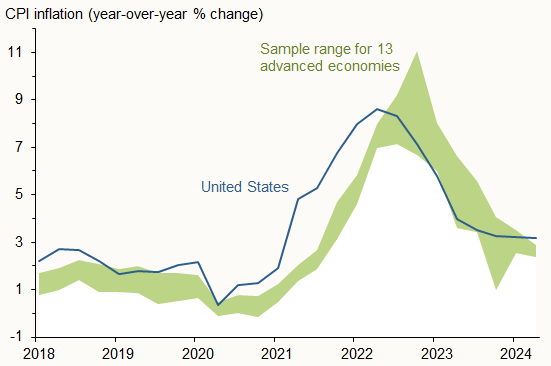
Figure 1 illustrates the motivation for our analysis. It compares four-quarter headline consumer price index (CPI) inflation rates for the United States with a measure of international inflation that uses a summary range for a set of 13 advanced economies: Australia, Belgium, Canada, Denmark, France, Ireland, Italy, Japan, Luxembourg, Netherlands, Portugal, Sweden, and the United Kingdom. The summary range for these 13 economies consists of the spread between the 75th and 25th percentiles of their distribution of inflation rates, also known as the interquartile range.
Figure 1
U.S. and advanced economy inflation rates

Source: Bureau of Labor Statistics, International Monetary Fund, Eurostat, Organisation for Economic Co-operation and Development, and CEIC.
With some small differences in the levels, the figure shows that inflation rates have generally moved together since 2018, rising substantially starting in early 2021 and declining quickly since mid- to late 2022. This is not just a recent phenomenon. Jordà et al. (2019) showed that similar patterns existed even before the pandemic and for a wider range of countries.
To investigate the usual interplay between U.S. and international inflation, we need to remove the outsize influence of the pandemic “bump” evident in Figure 1. We do so by first measuring each of the 13 countries’ inflation rates relative to a common, smoothed overall average. This step removes the pandemic trend that was common among all countries in this group. We then calculate the first principal component of the resulting set of series. This is a statistical technique that summarizes the cross-country variation in inflation rates using a single variable. The principal component can then be interpreted as characterizing the common variation in international inflation rates in normal times, which we then link to U.S inflation. Because the unemployment rate usually plays an important role in thinking about how demand factors influence inflation, we also calculate the first principal component of the unemployment rate across the same 13 countries in a similar manner.
For this analysis, we rely on quarterly data for unemployment and four-quarter CPI inflation rates between the first quarter of 1983 and the second quarter of 2024. Using the statistical procedures described earlier, we calculate two new variables, which we refer to as the international unemployment and the international inflation factors.
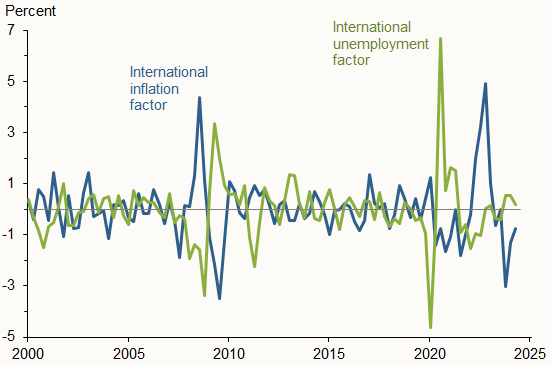
Figure 2 presents these two international factors since 2000 scaled by their respective standard deviations relative to the overall average. The figure shows that fluctuations of international inflation (blue line) and international unemployment (green line) during the pandemic were quite sizable, on the order of four to six standard deviations relative to their pre-pandemic averages. Such extreme volatility only happened previously in our data sample during the Global Financial Crisis, between 2008 and 2010.
Figure 2
Scaled international inflation and unemployment

With these summary statistics in hand, we next turn to assessing how the international inflation and unemployment factors affect U.S. inflation dynamics.
Explaining inflation: An augmented Phillips curve
The Phillips curve provides a well-known and widely used framework to account for the different drivers of U.S. inflation. Our version of the Phillips curve considers the following three drivers: a measure of economic slack that accounts for demand-side forces, lagged inflation, and expected future inflation. The last two account for the inherent momentum in inflation.
According to the Phillips curve, the less slack there is in the labor market, the more stretched the economy’s resources are, and the more pressure there is on prices. That said, inflation tends to respond gradually to fluctuations in economic activity that affect overall slack. Like a big ocean liner trying to change direction, inflation carries considerable momentum that depends partly on past inflation. Moreover, if people believe the central bank is conducting monetary policy appropriately to keep inflation at its goal, they will be less concerned about small deviations from course and instead rely more on the targeted level of inflation when they consider their expectations for future inflation.
Our final specification thus includes the four-quarter lagged value of U.S. inflation, one-year-ahead CPI inflation expectations from the Survey of Professional Forecasters, and the gap between the unemployment rate and its natural rate as measured by the Congressional Budget Office. The natural rate of unemployment is the rate that would prevail in an economy operating at full productive capacity. The unemployment gap is positive when the economy’s resources are underutilized and is negative otherwise, making it a standard measure of economic slack.
To assess the effects of international factors on U.S. inflation dynamics, we augment these standard Phillips curve drivers with the two international factors plotted in Figure 2 and some additional control variables.
Our control variables account for other important supply-side factors that could give us a false reading on the relevance of the inflation principal component if they were omitted. Specifically, we include oil price inflation measured by West Texas Intermediate (WTI). In addition, although we have removed a common trend, we include an indicator of supply-chain disruptions provided by the New York Fed, the Global Supply Chain Pressure Index (GSCPI). Both oil prices and supply-chain disruptions have been shown to have affected U.S. inflation readings, particularly since the pandemic (Shapiro 2022).
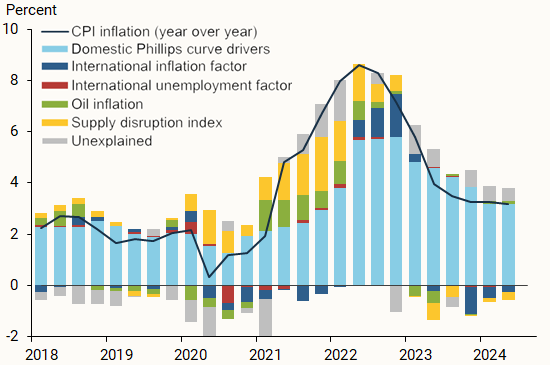
Figure 3 reports the results of our analysis. The figure shows the contributions of each of the drivers to U.S. inflation each quarter since 2018. We simplified the figure by lumping together lagged inflation, U.S. inflation expectations, and the unemployment gap under the label “domestic Phillips curve drivers” (light blue bars). All other components are reported separately. Finally, we show the fluctuations in U.S. inflation that remain unexplained by our extended model (gray bars).
Figure 3
Domestic and international drivers of U.S. inflation

The figure yields several interesting insights. First, movements in U.S. inflation are largely explained by the domestic Phillips curve drivers.
Second, the contribution of the international inflation factor (dark blue bars) is rather small until after the pandemic period from 2020 onward. Between the first quarter of 2021 and the fourth quarter of 2022, the international inflation factor added about 2 percentage points to the rise in U.S. inflation. International factors during that period show a large influence, even though our method removes the common trend and includes measures of both supply-chain disruptions and oil prices. In contrast, since the end of 2022, the international inflation factor has contributed about 1.6 percentage points to the decline in U.S. inflation.
The figure also shows that supply-chain disruptions (gold bars) explained a significant share of the movement in U.S. inflation during the pandemic, especially between 2020 and 2022, but the relevance of this driver has since waned considerably.
Finally, although we build numerous components into our model, the special nature of the pandemic is reflected through the sizable share of inflation that cannot be explained by any of the drivers included in our analysis. The contribution of the unexplained component (gray bars) is particularly relevant during the early stages of the pandemic, suggesting that the conventional Phillips curve model does not fully account for inflation dynamics during this period, as argued by Benigno and Eggertson (2023).
The international contributions to components of U.S. inflation
Our results indicate that international inflation factors have contributed importantly to the dynamics of U.S. inflation since 2021. We can gain more insights by analyzing which economic sectors are most exposed to these international factors.
We examine this relationship by estimating the effects of the international inflation factor on U.S. inflation rates broken down by sector. More specifically, we estimate the same Phillips curve relationships we used earlier, but we now consider several sectoral inflation measures that represent different categories of products with different inflation determinants and persistence. Specifically, we estimate the effects on goods inflation, “supercore” inflation—which includes services but excludes goods, food, energy, and housing components—and housing inflation.
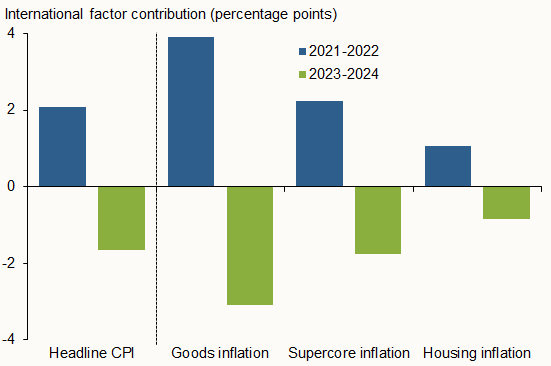
Figure 4 summarizes the contributions of the international factor to each of these measures of inflation over two periods, 2021–2022 and 2023–2024. The figure also shows the contributions to overall headline inflation for context.
Figure 4
International contributions to U.S. inflation components

The influence of the international inflation factor is strongest on goods inflation. This is as expected: the goods category is most exposed to trade and therefore to the influence of the common factor in international inflation. The international inflation factor has contributed nearly 4 percentage points to the rise in goods prices during the pandemic and about 3 percentage points to their decline since 2023. In contrast, the international factor contributed nearly half that amount to the rise of supercore inflation and even less to housing costs.
The patterns shown in Figure 4 suggest that an important channel of transmission can be associated with international trade. This therefore corroborates our conjecture that a demand channel likely explains the transmission of inflation across countries. While services tend to be more insulated than goods from international influence, they can also be affected through different channels, such as input costs or direct demand from international travelers, for example.
Conclusion
In this Letter, we remove the outsize role of the pandemic to analyze how international inflation and unemployment factors can contribute to our understanding of recent U.S. inflation fluctuations. Our model suggests that, although domestic Phillips curve factors are the primary drivers of U.S. inflation during normal times, international factors can occasionally boost or dampen domestic inflation. These results are further corroborated by analyzing the components of U.S. inflation. Thus, a global soft landing, recently emphasized as a possibility by the International Monetary Fund (Gourinchas 2024), could contribute to further reductions in U.S. inflation.
References
Auer, Raphael, Mathieu Pedemonte, and Raphael S. Schoenle. 2024. “Sixty Years of Global Inflation: A Post-GFC Update.” FRB Cleveland Working Paper 24-10.
Benigno, Pierpaolo, and Gauti B. Eggertsson. 2023. “It’s Baaack: The Surge in Inflation in the 2020s and the Return of the Non-Linear Phillips Curve.” NBER Working Paper 31197.
Gourinchas, Pierre-Olivier. 2024. “Global Economy Approaches Soft-Landing, But Risks Remain.” IMF Blog, January 30.
Jordà, Òscar, Chitra Marti, Fernanda Nechio, and Eric Tallman. 2019. “Why Is Inflation Low Globally?” FRBSF Economic Letter 2019-19 (July 15).
Shapiro, Adam Hale. 2022. “How Much Do Supply and Demand Drive Inflation?” FRBSF Economic Letter 2022-15 (June 21).
Opinions expressed in FRBSF Economic Letter do not necessarily reflect the views of the management of the Federal Reserve Bank of San Francisco or of the Board of Governors of the Federal Reserve System. This publication is edited by Anita Todd and Karen Barnes. Permission to reprint portions of articles or whole articles must be obtained in writing. Please send editorial comments and requests for reprint permission to research.library@sf.frb.org

