During the post-pandemic period, the vacancy-unemployment ratio was at historically high levels, but the strength of overall labor demand was unclear. Analysis using data from the National Federation of Independent Business on firms’ perceptions of the labor market confirms that during that time firms perceived the labor market as being unusually tight relative to historical norms. As of June-August 2024, however, both firms’ perceptions and measures of labor market tightness had returned to their 2019 levels.
The onset of the pandemic brought great uncertainty into the labor market. Between March and May 2020, the unemployment rate shot up from 3.5% to 14.7% and job vacancies plummeted. This spike was followed by a swift reversal, as the ratio of job vacancies to the number of unemployed people reached historic highs. Economic analysts closely monitor this ratio because it has been a good measure of overall labor market tightness historically and can help predict changes in inflation (see, for example, Barnichon and Shapiro 2024). Yet, the unique conditions during the pandemic recovery—unusual spending patterns, supply bottlenecks, new work practices, and others—made it unclear whether the surge in the vacancies to unemployment (V–U) ratio truly reflected a surge in demand for labor as opposed to supply constraints, measurement issues, or other structural shifts.
In this Economic Letter, we assess the behavior of the V–U ratio during the pandemic recovery using an independent source of information on labor market tightness, firms’ own perceptions about the labor market. Specifically, we use survey data from the National Federation of Independent Business on firms’ responses regarding whether they have job openings that they are unable to fill. We use the percentage of businesses reporting unfilled vacancies as a measure of firm labor market perceptions. We study how this measure correlates with the V–U ratio over time, particularly during the pandemic period.
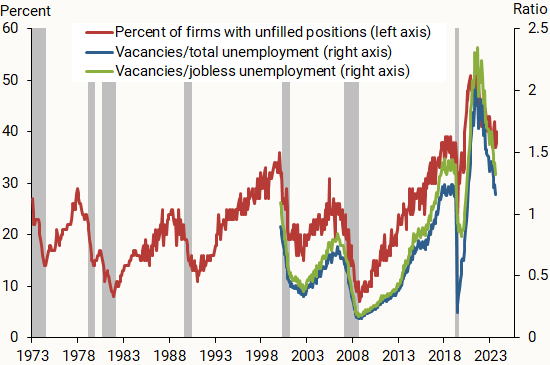
We find that firm labor market perceptions during the pre-pandemic period aligned well with overall measures of labor market tightness. From May 2020 through the end of 2021, both data on labor market perceptions and the V–U ratio rose sharply. The increase in firms’ perceptions that vacancies were hard to fill was especially large, well above what the historical relationship between these two series would have predicted. That is, firm labor market perceptions signaled a much tighter labor market from May 2020 to December 2021 than did the V–U ratio. Since 2021, both firm labor market perceptions and the V–U ratio have been steadily declining. As of August 2024, the relationship between firms’ perceptions and measures of labor market tightness had returned to its pre-pandemic pattern.
Firms’ perceptions and the aggregate labor market
Our firm perceptions data come from the Small Business Economic Trends data published by the National Federation of Independent Business (NFIB) via the Conference Board since 1973 (Dunkelberg and Wade 2024). The NFIB releases a monthly jobs report on the second Tuesday of the month, which provides results from the prior month’s survey. We use NFIB survey data from November 1973 through August 2024.
We use vacancies data from the Job Openings and Labor Turnover Survey (JOLTS) published by the Bureau of Labor Statistics (BLS) each month. The BLS typically releases unemployment data on the first Friday of each month following the reference month. Thus, the NFIB survey data are available soon after the unemployment data and about two weeks before the BLS releases vacancies data.
We use responses to the NFIB survey question, “Do you have any job openings that you are not able to fill right now?” The Conference Board reports the percentage of firms answering “yes” each month. We refer to the series as firm labor market perceptions, with the caveat that the series captures the sentiments of NFIB firms, which are small businesses, so the data may not be representative of firms of all sizes.
Figure 1 shows the time series of firm labor market perceptions (red line), along with two measures we will discuss in a later section. Between 1973 and 2024, the percent of small firms with unfilled openings has ranged roughly between 10% and 50%. Higher values indicate more businesses have positions they are not able to fill. The series is procyclical, falling during recessions and climbing during recoveries.
Figure 1
Firm labor market perceptions and V-U ratios

Source: NFIB via the Conference Board, Bureau of Labor Statistics, and authors’ calculations; data through August 2024.
Firms’ perceptions and unemployment
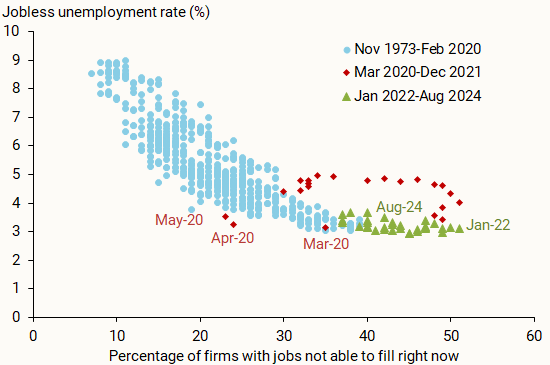
We start by analyzing how firms’ perceptions about the labor market relate to the unemployment rate. Figure 2 shows the relationship between the jobless unemployment rate on the vertical axis and firm labor market perceptions on the horizontal axis. We break the series into three separate periods: the pre-pandemic period, November 1973 through February 2020 (light blue dots), the pandemic period, March 2020 through December 2021 (red diamonds), and the post-pandemic period from January 2022 through the latest data available for August 2024 (green triangles).
Figure 2
Firm labor market perceptions and jobless unemployment

We use the jobless unemployment rate instead of the official rate because of recent work finding that it is likely a better measure of unemployment around the pandemic era (Hall and Kudlyak 2022). The jobless unemployment rate removes those who are unemployed due to temporary layoffs to track those unemployed without jobs. Nonetheless, the results below are similar using the official unemployment rate.
The figure shows a tight negative relationship between firm labor market perceptions and the jobless unemployment rate before the pandemic. During the pandemic, the relationship between these two series diverged from this historical close link. Firms perceived the labor market as tighter than the level signaled by the jobless unemployment rate. After 2021, however, the relationship between firms’ perceptions and the jobless rate returned to its historical pattern.
Firms’ perceptions and V-U measures
In addition to the jobless unemployment rate, another useful measure of labor market conditions is the vacancy-unemployment or V–U ratio. For instance, Barnichon and Shapiro (2024) find that the V–U ratio predicts inflation better than the official unemployment rate. In Figure 1, we plot two versions of the V–U ratio, one based on official unemployment (blue line) and one based on jobless unemployment (green line), as described in Hall and Kudlyak (2022). The two series have historically moved closely together. Notably, between February and April 2020, each ratio plummeted, with the dip being less dramatic for the ratio of vacancies to jobless unemployment. This was followed by a rapid recovery until their peaks in 2021–2022 and subsequent gradual declines towards pre-pandemic levels.
Similarly, the average duration of vacancies, calculated as the ratio of job openings to hires in a month, also reached historic highs following the pandemic and has since been slowly declining (not shown). Various explanations have emerged about the run-up of job vacancies in 2020 and 2021. For instance, Leduc and Oliveira (2023) describe the period as firms hoarding labor due to concerns of finding new workers. Alternatively, some measurement issues could have affected the vacancy data. In particular, the JOLTS response rate underlying job openings data has declined substantially in recent years to below 30%, prompting worries about the reliability of the V–U ratio in recent years (Abraham 2024).
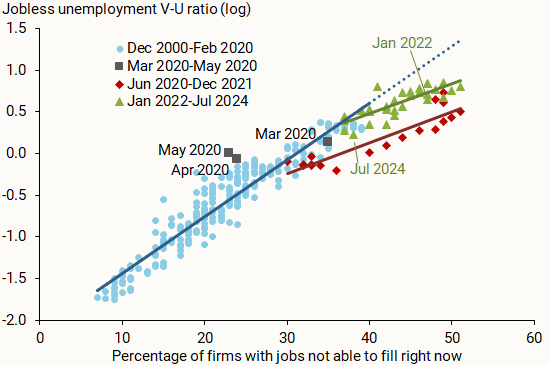
Figure 3 depicts the relationship between firm labor market perceptions on the horizontal axis and aggregate labor market tightness using, for ease of comparison, the natural log of the V–U ratio based on jobless unemployment on the vertical axis. We separate the three periods as before, and we introduce a fourth group for March to May of 2020 (gray squares). For each of the periods excluding March to May 2020, we estimate a linear regression model to show the relationship between the log of the vacancy–jobless unemployment ratio and the measure of firm labor market perceptions.
Figure 3
Firm labor market perceptions and jobless unemployment V-U

We find that before March 2020, there was a tight linear relationship between the log of the V–U ratio and firm labor market perceptions (blue fitted line).
In the June 2020 to December 2021 period, the relationship shifted downward (red fitted line). That is, the V–U ratio signaled a less tight labor market than what firms perceived, relative to their historical association.
Finally, during the 2022–2024 period, the relationship shifted back up, but the slope is flatter than it was before the pandemic (dark blue line). That is, the V–U ratio still signals a less tight labor market than firms’ perceptions, relative to their historical association. However, the discrepancy has lessened as the measure of perceptions has declined. In fact, most recently, the relationship has returned to its pre-pandemic pattern.
Conclusion
In this Letter, we find that, despite historically high ratios of job vacancies to unemployment after the pandemic, firms perceived the labor market as being even tighter. This goes against a more common view, which posits that an unusually high number of vacancies immediately after the pandemic might have been an aberration rather than a reflection of high labor demand relative to labor supply. Furthermore, in Kudlyak and Miskanic (2024), we compare firm labor market perceptions with consumer labor market perceptions and find that firms perceived the labor market as being tighter than consumers did. Taken together, our findings highlight the usefulness of monitoring survey data on perceptions of labor market conditions, especially in times when these conditions are uncertain and potentially changing rapidly.
References
Abraham, Katharine G. 2024. “Discussion of “Phillips Meets Beveridge,” by Regis Barnichon and Adam Shapiro.” Journal of Monetary Economics, forthcoming.
Barnichon, Regis, and Adam Shapiro. 2024. “Phillips Meets Beveridge.” Journal of Monetary Economics, forthcoming.
Dunkelberg, William C., and Holly Wade. 2024. “Small Business Economic Trends.” National Federation of Independent Business Research Center (2014-06).
Hall, Robert E., and Marianna Kudlyak. 2022. “The Unemployed With Jobs and Without Jobs.” Labour Economics 79(102244).
Kudlyak, Marianna, and Brandon Miskanic. 2024. “Consumer and Firm Perceptions of the Aggregate Labor Market Conditions.” FRB San Francisco Working Paper 2024-28.
Leduc, Sylvain, and Luiz Edgard Oliveira. 2023. “From Hiring Difficulties to Labor Hoarding?” FRBSF Economic Letter 2023-32 (December 18).
Opinions expressed in FRBSF Economic Letter do not necessarily reflect the views of the management of the Federal Reserve Bank of San Francisco or of the Board of Governors of the Federal Reserve System. This publication is edited by Anita Todd and Karen Barnes. Permission to reprint portions of articles or whole articles must be obtained in writing. Please send editorial comments and requests for reprint permission to research.library@sf.frb.org
