U.S. labor productivity initially surged in 2020 during the COVID-19 pandemic, despite the massive economic upheaval. As the economy recovered, the level of productivity retreated to its slow pre-pandemic trend. As of mid-2024, it remained close to but just above that trend. The surge and retreat in productivity follows the pre-pandemic cyclical relationship in which U.S. productivity rises temporarily in recessions. This example highlights the need to look through temporary cyclical effects when trying to infer longer-run trends.
Productivity growth is an important driver of improvements in people’s living standards. Before the pandemic, many advanced economies, including the United States, struggled with slow growth in labor productivity, as measured by output per hour worked.
In this Economic Letter, we discuss how U.S. productivity behaved during and since the pandemic. Productivity initially surged well above its pre-pandemic trend. But as the economy reopened and economic activity rebounded, it soon reverted to that trend. This pandemic boom-and-bust in productivity growth was a predictable cyclical response overlaid on a broad continuation of the underlying slow growth pace. It largely confirms the cautionary arguments in Fernald and Li (2022) before productivity had fully returned to trend.
U.S. productivity boom-and-bust since 2020
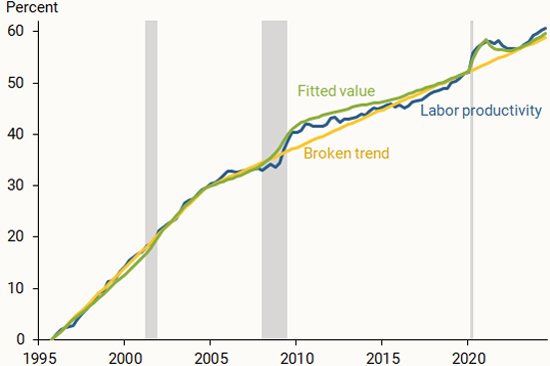
We measure labor productivity growth as the difference between real, that is inflation-adjusted, output growth and hours growth using data from the Bureau of Economic Analysis and the Bureau of Labor Statistics. The blue line in Figure 1 shows the level of U.S. business-sector labor productivity relative to 1995. The gold line shows a simple linear trend estimate, but with a different slope after 2004, when the growth trend slowed.
Figure 1
Cyclicality of labor productivity

Source: Bureau of Labor Statistics, Fernald (2014) with data update from November 7, 2024, and authors’ calculations. Gray shading indicates NBER recession dates.
When the pandemic struck in 2020, the economy was thrown into disarray. Productivity initially soared well above its pre-pandemic trend, raising the possibility that forced technology adoption or the benefits of working from home might generate persistent productivity gains. But by the beginning of 2023, productivity had retreated to its slower trend. This return to trend is consistent with other analysis showing that industries with more work-from-home occupations did not see greater productivity gains after 2020 than other industries (Fernald et al. 2024). Since then, productivity has remained close to though slightly above its slow post-2004 trend.
Looking back, a qualitatively similar experience occurred around the Great Recession of 2007 to 2009. Labor productivity rose sharply above its pre-recession trend, then gradually returned to trend over a few years. This pattern suggests that productivity growth more generally has a systematic relationship with the business cycle.
To evaluate this relationship, we follow the regression approach in Fernald et al. (2017) and Daly et al. (2017). This approach uses changes in the unemployment rate as an indicator of changes in cyclical conditions. By relating labor productivity growth to the four-quarter change in the unemployment rate to allow for lagged effects, we can capture the systematic cyclical properties of labor productivity data. Our regression analysis allows the trend component to change at the end of 2004; this is consistent with the linear broken trend estimate in Figure 1, marking the end of the exceptional 1995–2004 productivity boom from information and communications technology innovations. We estimate the statistical relationship from 1995–2019, so the estimation period ends before the pandemic.
We find a strong cyclical relationship: When unemployment continually rises over the year, productivity tends to rise as well, consistent with prior studies (Fernald and Wang 2016). The green line in Figure 1 shows what the relationship predicts for labor productivity, given the trend and actual changes in the unemployment rate. The predicted values broadly fit the labor productivity boom during the Great Recession, when unemployment rose, and its apparent subsequent weakness as unemployment and productivity returned to trend.
The green line also shows how we would have expected labor productivity to evolve during and after the pandemic, based on the pre-pandemic cyclical relationship and trend. There are many reasons productivity growth might have altered historical patterns. After all, the pandemic economic shocks were unique, including disruptions to supply chains and goods manufacturing, closing of in-person businesses, and forced digital innovation.
Yet, the simple pre-pandemic relationship between productivity and unemployment, plus the pre-pandemic trend, predicts actual productivity growth during and after the pandemic remarkably well. Though the unemployment rate around the pandemic rose and fell much faster than around the Great Recession, its link to productivity growth was similar.
Why is productivity countercyclical?
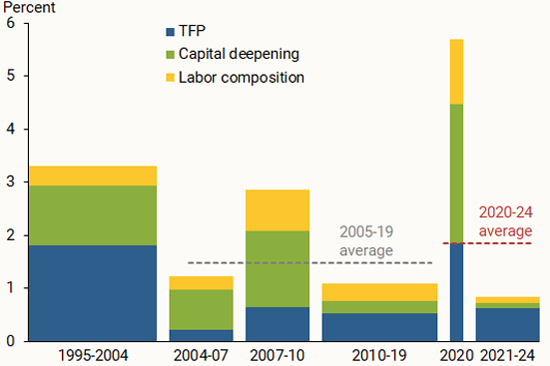
To gain insight into why labor productivity growth was so strong in the Great Recession, Figure 2 presents our labor productivity data in a different way. The height of the bars shows the average annual rate of productivity growth in selected subperiods. The first bar from 1995 through 2004 corresponds to the fast growth period associated with the rollout of the Internet and other information and communications technology innovations (Fernald and Wang 2015). Productivity growth averaged around 1½% per year from 2005 through 2019, shown by the dashed gray line in the figure. The pace since 2019 (red dashed line), is about 0.40 percentage point higher but is still well below the pace before 2005. Within those broader periods, the 2007–10 bar shows the burst in productivity growth during and after the Great Recession, and the 2020 bar shows the burst during the pandemic.
Figure 2
Average contributions to growth in U.S. output per hour

Source: Fernald (2014) with data update from November 7, 2024.
The colored sections of the bars break productivity growth into three contributing factors. Labor composition (gold bars) captures the effect of changes in the composition of workers, based on education and experience, to productivity growth. The contribution of labor composition varies over the business cycle. During both the Great Recession and the pandemic, workers with less education and experience disproportionately lost jobs, raising the average education and experience of those who continued to work. The effect was large enough to noticeably boost labor productivity in the short term. This is not a sustainable or desirable reason for productivity to rise, since a well-functioning labor market creates jobs for all types of workers. In the years following the Great Recession and the pandemic, many of those workers returned to work and this cyclical effect on labor composition unwound. Hence, labor composition added less to productivity growth in the 2010–19 period and even less in the 2021–24 period.
A second reason for the surge in productivity growth during the Great Recession and the pandemic was that each worker had more or better “tools” to work with (green bars). An important driver of productivity growth over time is that companies invest in new plants, equipment, and intellectual capital and gradually automate processes. Each existing worker can then produce more in each hour they work. As with labor composition, this long-run factor can be temporarily and unsustainably affected by the business cycle. During the pandemic, available capital changed little but there were fewer available workers. Hence, each worker had more capital to work with, leading to higher capital deepening. An important part of this capital deepening effect arose during the pandemic, when production temporarily shifted away from less capital-intensive industries such as leisure and hospitality (Fernald and Li 2022). The shift unwound when the less capital-intensive industries reopened.
The final component is total factor productivity (TFP). TFP growth (blue bars) reflects labor productivity growth after controlling for the effects of changes in capital intensity and labor composition. In the long run, the most important driver of TFP growth is innovation. But in the short run, business-cycle factors are also important. Early in a recovery, for example, it takes time for companies to hire the workers they need to sustainably meet the rebound in demand. They might be especially slow to fill positions if they are not sure how strong the rebound will be. In the meantime, they ask existing workers to work harder, which might not be sustainable in the long run and may cause workers to quit. Since labor productivity is output per hour worked, it does not adjust for variations in the intensity that workers put in, so that variation would not be controlled for through capital intensity or labor composition. During periods when intensity is rising, such as early in a recovery, measured TFP growth will be very high; later, as effort wanes, measured TFP growth will be lower.
In the pandemic, these TFP dynamics played out. In 2020, which included the severe second-quarter downturn and the fast economic recovery later that year, TFP growth was strong. During that recovery, workers who had jobs worked longer hours and, presumably, also needed to work harder. Anecdotally, workers reported getting “burned out” to an unusual degree in 2020 and 2021. In the subsequent period, as employment returned to normal, worker hours fell and, workers reported “quiet quitting.” This flow and ebb of work intensity is one reason TFP growth is volatile. Nevertheless, since the beginning of 2021, TFP grew just slightly faster than its average 2010–19 pace.
In sum, the surge in productivity growth in 2020 appears to reflect large cyclical dynamics superimposed on a continuation of the slow pre-pandemic trend. Since the middle of 2023, productivity grew somewhat faster than what our analysis predicted but is still much slower than the pace from 1995 to 2004.
Conclusion
The U.S. economy entered the pandemic on a slow productivity path, which contributed to relatively low expected growth. During the pandemic, productivity initially boomed, and some observers pointed to forced technology adoption or the benefits of working from home to suggest the gains might persist. Unfortunately, as the recovery continued, productivity gave up its gains and returned close to its slow pre-pandemic trend. This Letter points out that this pattern was, in many ways, predictable given the typical cyclical pattern of productivity growth and the pre-pandemic trend.
Yet there are some reasons for cautious optimism. Data revisions in September 2024 by the Bureau of Economic Analysis revealed faster output and productivity growth during and since the pandemic than previously estimated. However, much is still uncertain about the productivity effects of emerging technologies like generative artificial intelligence, which will only be revealed over time, as the economy continues to evolve in the aftermath of the pandemic.
References
Daly, Mary C., John G. Fernald, Òscar Jordà, and Fernanda Nechio. 2017. “Shocks and Adjustments.” FRB San Francisco Working Paper 2013-32 (revised July 2017).
Fernald, John G. 2014. “A Quarterly, Utilization-Adjusted Series on Total Factor Productivity.” FRB Working Paper 2012-19 (revised April 2014).
Fernald, John, and Bing Wang. 2015. “The Recent Rise and Fall of Rapid Productivity Growth.” FRBSF Economic Letter 2015-04 (February 9).
Fernald, John G., Robert E. Hall, James H. Stock, and Mark W. Watson. 2017. “The Disappointing Recovery of Output after 2009.” Brookings Papers on Economic Activity 2017(1), pp. 1–81.
Fernald, John, Ethan Goode, Huiyu Li, and Brigid Meisenbacher. 2024. “Does Working from Home Boost Productivity Growth?” FRBSF Economic Letter 2024-02 (July 1).
Fernald, John, and Huiyu Li. 2022. “The Impact of COVID on Productivity and Potential Output.” Jackson Hole Symposium Proceedings.
Opinions expressed in FRBSF Economic Letter do not necessarily reflect the views of the management of the Federal Reserve Bank of San Francisco or of the Board of Governors of the Federal Reserve System. This publication is edited by Anita Todd and Karen Barnes. Permission to reprint portions of articles or whole articles must be obtained in writing. Please send editorial comments and requests for reprint permission to research.library@sf.frb.org

