The housing market experienced historically low levels of inventory along with rapid price growth in the two years following the onset of the pandemic. Analysis of national and county-level housing data suggests this price surge was fueled by heightened demand rather than low supply. The inflow of new listings remained at pre-pandemic levels, but the outflow due to sales was unusually high, which fed into the low inventory. By mid-2022, rising mortgage rates moderated demand, allowing inventory levels to return to pre-pandemic trends.
The COVID-19 pandemic brought about unprecedented shifts in the housing market. From late 2020 to early 2022, historically low mortgage rates and a growing need for home office space drove a surge in housing demand (Mondragon and Wieland 2022). During this period, housing shortages were exacerbated by supply-chain disruptions and labor shortages, which limited the construction of new homes (Palin and Zimmerman 2023). This tight housing market—characterized by high demand and limited supply—was reflected in rapid house price growth and sharp declines in inventory. Housing inventories have since increased from historic lows during the pandemic.
In this Economic Letter, we assess the relative importance of supply and demand factors in fueling these housing market dynamics. Our analysis follows Anenberg and Ringo (2024), who demonstrate the importance of flows in the housing market for gauging the relative impact of demand and supply shocks. Specifically, we focus on the net changes in housing inventory, represented by new listings moving into the housing stock minus sales moving out of the stock.
The data on net flows reveal that new listings were consistent with pre-pandemic levels from late 2020 to early 2022, while sales saw significant growth. This reduced the net inflow of housing, tightening the flow of homes into the available housing inventory. We also show that, across U.S. counties, changes in inventory have a strong negative correlation with the changes in sales, while changes in new listings have little correlation with changes in inventory. This phenomenon of high outflows due to sales persisted until mortgage rates moved higher in early to mid-2022, at which point sales declined significantly more than new listings. Since then, the gap between new listings and sales has returned to pre-pandemic levels, helping to push housing inventories back up to its pre-pandemic trend. Taken as a whole, our analysis suggests that strong demand was the main driver of low inventory during the pandemic, and rising mortgage rates have since tempered net housing demand to return to more typical levels.
Inventory and house prices in the pandemic era
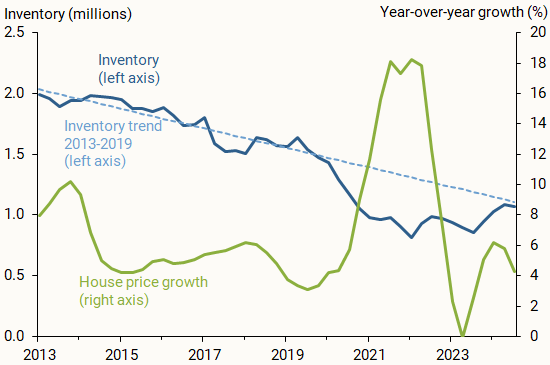
Housing inventory refers to the stock of housing units available for purchase. Figure 1 shows housing inventory (blue solid line) from data provided by Zillow, along with its pre-pandemic trend (blue dashed line). The trend, based on data from 2013 to 2019, is intended to provide a simple forecast of what would have happened to inventory without the pandemic and associated policy interventions. Although we cannot be certain that this trend would have continued along the same path, it provides a useful benchmark for current inventory levels. Data from other sources, such as Redfin, show similar levels and trends in inventory.
Figure 1
Housing inventory and price growth

Housing inventory had been steadily declining since the recovery from the Great Recession, falling about 3.7% annually from 2013 to 2019. Although there is no clear consensus on the primary cause of this decline, persistently weak housing construction since the financial crisis was likely an important factor. Figure 1 shows that inventory fell below its pre-pandemic trend in 2020 and 2021, but began to recover by mid-2022, returning to its trend by 2024.
The sharp drop in inventory coincided with house prices rising at exceptionally high rates—over 15% annually (green solid line). However, by mid-2022, house price growth moderated significantly, alongside the recovery in inventory. House price growth gradually returned to a more typical pace and is currently about 4 to 6% per year.
The inflows and outflows of housing inventory
We examine the changes in inventory over this period by separating the flows of housing units into and out of the market. Similar to other “stock” measures, the current stock depends on the previous period’s supply plus the net inflows—that is, inflow minus outflow. In housing markets, current inventory depends on the previous quarter’s inventory level plus the net number of newly available housing units. The flows into the market reflect households listing their existing homes for sale or builders constructing new homes, which are together captured in new listings. The flows out of inventory are primarily driven by households purchasing homes—that is, sales. Outflows can also include sellers who take their homes off the market; however, we do not account for this due to a lack of available data.
In a typical housing market, most homeowners who purchase a home will subsequently list their existing home on the market. For this reason, the flows into and out of the housing stock—that is, sales and new listings—are normally at similar levels and move in tandem. In other words, the net flow of housing units into inventory, represented by new listings minus sales, should be roughly constant if changes to supply and demand for housing are relatively balanced. The relative movements of the two measures are indicative of whether supply or demand factors are at play in any given moment. A widening of this gap caused by a rise in new listings relative to sales indicates a relative expansion in the housing supply. By contrast, a widening of this gap caused by a decline in sales suggests relatively weaker demand.
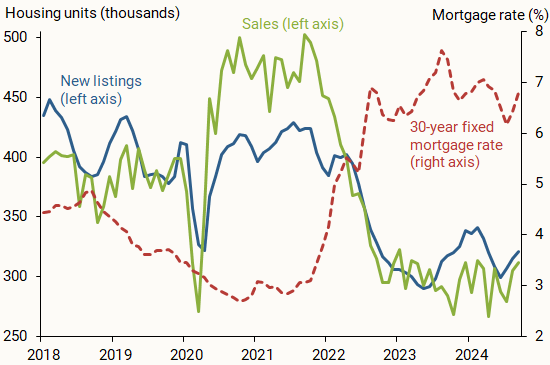
Figure 2 plots the national count of sales (green line) and new listings (blue line) from data provided by Zillow, along with the 30-year mortgage rate (red dashed line) on new originations from Freddie Mac from 2018 and 2024. Sales and new listings were roughly equal leading up to the pandemic. However, after the short-lived shutdown in housing markets in early 2020, sales spiked up about 25% relative to 2019 and remained elevated until early 2022. New listings, by contrast, quickly returned to 2019 levels and remained there until mid-2022. The elevated level of sales compared with more typical levels of new listings implied a persistent net outflow of available housing from 2020 through mid-2022. Total sales surpassed total new listings by about 50,000 housing units per month over this period. By contrast, new listings outpaced sales by about 20,000 per month on average in 2019. Net housing inflows shifted substantially during this period, suggesting that strong demand played the dominant role in reducing inventory.
Figure 2
Housing inventory inflows and outflows

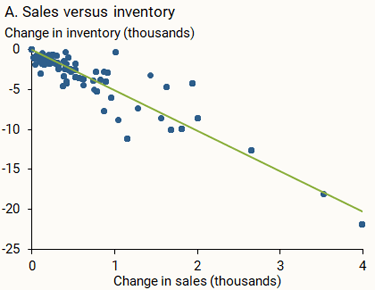
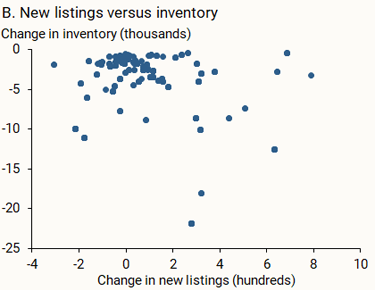
For a deeper analysis, we examine the more detailed county-level Zillow data on sales, new listings, and inventory. We measure the change in each of these variables between an initial baseline period of 2019, and a later period of mid-2020 to mid-2022 in Figure 3. Each point represents an individual county for the largest 1,300 counties available in Zillow.
Figure 3
County-level housing data on sales, new listings, and inventory


Source: Zillow Analytics, January 2012 through January 2024, and authors’ analysis.
Panel A of Figure 3 plots the change in sales on the horizontal axis in relation to the change in inventory by county on the vertical axis. The figure shows that increases in sales are strongly associated with declines in inventory, with a negative correlation of close to 90%. By contrast, panel B shows that changes in new listings on the horizontal axis are essentially uncorrelated with changes in inventory on the vertical axis. Thus, the county-level data are consistent with increases in sales, rather than declines in new listings, as driving declines in inventory.
Housing flows during and after monetary policy tightening
By late 2021, the Federal Reserve shifted its policy stance away from accommodation aimed at boosting economic growth and began forward guidance about future monetary policy tightening, particularly raising interest rates. Figure 2 shows that both house sales and new listings began to slow in early 2022, alongside the steep rise in the 30-year mortgage rate. However, sales declined more sharply than new listings, which led to an increase in housing inventory. Specifically, sales averaged close to 500,000 per month in 2021 and then dropped by 200,000 per month, reaching 300,000 units per month in 2023, which continued through November 2024. By contrast, new listings fell about 100,000 per month over the same period, leveling off at 300,000 per month—the same level as sales. The decline of the new listings back to the level of sales is consistent with a normalizing of the flows into and out of the housing stock, and so a return to an equal balance of supply and demand pressures.
It is unclear whether housing demand would have stayed as strong if the Fed had not tightened policy through raising interest rates. However, the decline in housing turnover coinciding with the increase in mortgage rates suggests a causal relationship. Furthermore, the fact that sales fell more than new listings suggests that the primary effect of tighter monetary policy has been to temper housing demand, rather than restrict supply. In fact, the strong decline in sales and more modest decline in new listings has helped raise inventory, indicating that elevated mortgage rates played a key role in balancing demand and supply. This also aligns with the evidence in Figure 1 showing that price growth eventually returned to a more stable pre-pandemic rate, as well as research showing that monetary policy can impact house prices quickly (Gorea, Kryvtsov, and Kudlyak 2022).
Conclusion
Our analysis in this Letter shows that broad shifts in demand were the primary drivers for large swings in housing inventory from 2020 to early 2024. The surge in demand during the height of the pandemic significantly eased after the rise in mortgage interest rates in early to mid-2022. By contrast, changes in the flow of new listings played a relatively smaller role in influencing inventory levels.
While both sales and new listings remain low compared with pre-pandemic levels, inventory and house price growth have generally returned to their pre-pandemic trends. Going forward, the gap between sales and new listings will be a key indicator of inventory and house price dynamics. For example, a decline in mortgage rates could reignite housing demand, renewing the squeeze on inventory. On the flip side, if conditions support an increase in new construction, that could boost housing inflows and alleviate inventory constraints. Monitoring net inflows into the housing market will provide valuable insights into the evolving supply and demand pressures in the housing market.
References
Anenberg, Elliot, and Daniel Ringo. 2024. “Volatility in Home Sales and Prices: Supply or Demand?” Journal of Urban Economics 139 (103610).
Gorea, Denis, Oleksiy Kryvtsov, and Marianna Kudlyak. 2022. “House Price Responses to Monetary Policy Surprises: Evidence from the U.S. Listings Data.” FRBSF Working Paper 2022-16.
Mondragon, John A., and Johannes Wieland. 2022. “Housing Demand and Remote Work.” National Bureau of Economic Research Working Paper 30041.
Palim, Mark, and Rachel Zimmerman. 2023. “‘Lock-in Effect’ Not the Only Reason for Housing Supply Woes.” Fannie Mae Perspectives Blog, October 30.
Opinions expressed in FRBSF Economic Letter do not necessarily reflect the views of the management of the Federal Reserve Bank of San Francisco or of the Board of Governors of the Federal Reserve System. This publication is edited by Anita Todd and Karen Barnes. Permission to reprint portions of articles or whole articles must be obtained in writing. Please send editorial comments and requests for reprint permission to research.library@sf.frb.org

