
Recent research has identified periods when the Federal Reserve intentionally acted to slow inflation when it exceeded desired levels. The success of these disinflation attempts reveals the extent of policymakers’ commitment to lowering inflation. An extension of this analysis indicates that successful disinflations are associated with a decline in the demand-driven component of inflation. This was especially evident during recent monetary policy tightening, with contributions to core inflation from demand declining 2 percentage points since the summer of 2022—the largest decline for any deliberate disinflation attempt since 1969.
Inflation has slowed significantly over the past two years. The 12-month change in the personal consumption expenditures (PCE) price index has declined about 5 percentage points since its peak in 2022. The corresponding change in the core measure, which excludes volatile food and energy categories, has declined 3 percentage points. This inflation slowdown occurred against the backdrop of substantial monetary policy tightening by the Federal Reserve, which raised the federal funds rate more than 5 percentage points between 2022 and 2023. However, monetary tightening was not the only possible contributor to slowing inflation, referred to as disinflation. Easing labor shortages, dissipating supply chain bottlenecks, and the fading effects of fiscal stimulus also likely played crucial roles. Thus, it is challenging to assess the extent to which monetary policy tightening was responsible for the recent decline in inflation.
In this Economic Letter, we compare the recent episode to other historical periods when the Federal Open Market Committee (FOMC) used tighter monetary policy to lower inflation. Research by Romer and Romer (2024) found that inflation tends to decline when the FOMC expresses a high commitment to disinflation. We expand on their work by assessing how the supply-driven and demand-driven contributions to inflation evolved over these different attempted disinflations. Since economic theory implies that monetary policy influences inflation via the demand channel, we use the demand-driven contribution to help isolate disinflationary effects stemming from the Federal Reserve’s actions.
Our results suggest the recent disinflationary period strongly resembles past episodes of high-commitment disinflation attempts. In fact, the demand-driven component of inflation has declined 2 percentage points in this recent period, which is more than in any other post-1969 disinflation attempt. This reduction in demand implies that recent Fed policy actions were quite successful in easing inflationary pressures. We further corroborate our results using high-frequency data on unexpected changes in the federal funds rate. Our estimates using these larger data series imply that core PCE inflation would have been approximately 3 percentage points higher on average between 2022 and 2024 if the FOMC had not raised interest rates in 2022 and 2023.
What are deliberate attempted disinflations?
Our analysis focuses on deliberate attempted disinflations by the Federal Reserve, as identified by Romer and Romer (2024). Using narrative evidence from FOMC transcripts, the authors categorize attempted disinflations based on three criteria. First, policymakers must express that the current level of inflation is unacceptable and that they desire to reduce it. Second, policymakers must take concrete steps to attempt to reduce inflation, such as raising interest rates. Third, policymakers must express that they are willing to accept output consequences to achieve disinflation. Once an attempted disinflation is identified, the authors assign the episode a low, medium, or high rating, indicating the strength of the Fed’s commitment based on the magnitude of the output costs policymakers were willing to accept and the degree to which policymakers were committed to bringing inflation down to a specific target.
We start with the five attempted disinflations that Romer and Romer identified since 1969. These include two low-commitment episodes in April 1974 and August 1978 and two medium- to high-commitment episodes in October 1979 and May 1981 when Paul Volcker was Fed chair. The fifth episode, labeled medium commitment, occurred in December 1988 under Chair Alan Greenspan. Romer and Romer show that inflation and output tend to decline following a disinflation attempt, while unemployment tends to rise, and these effects are larger for episodes when the FOMC had a stronger commitment.
In addition to these five disinflation attempts, we include the September 2022 FOMC meeting, representing the most recent period. This followed an August 26 speech by Chair Jerome Powell at the Jackson Hole Symposium, where he stated, “Reducing inflation is likely to require a sustained period of below-trend growth.” Romer and Romer identified the September 2022 FOMC meeting as having the strongest statements consistent with a contractionary monetary shock, but due to data limitations they did not include this episode in their analysis. At that meeting, the FOMC raised the target for the federal funds rate 0.75 percentage point, while also indicating in the Survey of Economic Projections that the policy rate would likely rise another 1.25 percentage points by the end of the year. September’s median end-of-year projection was 1 percentage point higher than the June 2022 median projection, suggesting that the FOMC had substantially tightened its monetary policy stance.
Supply and demand contributions during attempted disinflations
We extend the Romer and Romer analysis by evaluating the evolution of the supply- and demand-driven contributions to inflation after these disinflation attempts. These series, developed in Shapiro (2022, 2024), break core PCE inflation into supply- and demand-driven contributions using the underlying category-level price and quantity indexes. The series are constructed using over 100 goods and services categories in the PCE index to separate the changes in prices driven by shifts in demand and shifts in supply; see data updates at Supply- and Demand-Driven PCE Inflation.
Critically, the demand-driven contribution isolates the component of inflation that is theoretically more sensitive to monetary policy tightening. Therefore, assessing the supply and demand components separately can more precisely identify the impact of the Federal Reserve’s actions.
The blue and green solid lines in Figure 1 show the average cumulative responses to a medium- or high-commitment attempted disinflation of the supply- and demand-driven contributions to core PCE inflation, along with the shaded 68% and 90% confidence range around the estimates. We account for previous trends in supply- and demand-driven inflation, food and energy prices, and economic activity as measured by the vacancy-to-unemployment ratio and the industrial production index.
Figure 1
Response of demand-driven and supply-driven contributions to attempted disinflation

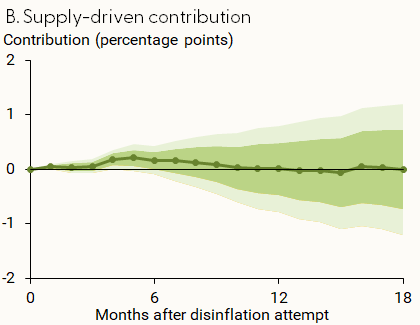
Note: Shading reflects confidence ranges of 68% and 90% around cumulative average estimates (solid lines).
Source: Bureau of Economic Analysis, Romer and Romer (2024), and authors’ calculations.
Our results indicate that the demand-driven contribution to core PCE inflation in panel A falls about 0.5 percentage point following the disinflation attempt, bottoming out 11 months afterward. In panel B, supply-driven inflation increases slightly in the 5 months following the disinflation attempt, but then dissipates to zero by 12 months. The slight increase in supply-driven inflation could reflect a cost-channel effect, whereby the rise in the cost of borrowing raises production costs (see Barth and Ramey 2001).
Figure 2 shows the supply and demand contributions to 12-month core PCE inflation over the most recent disinflation attempt. We show the change in contributions relative to the starting date, with each series equaling zero in September 2022. The demand-driven contribution fell over 2 percentage points in the 18 months that followed. This is significantly more than the average decline in demand-driven inflation in Figure 1. In fact, it is a larger decline than any other attempted disinflation since 1969. The demand-driven contribution declined 1 percentage point following the 1981 and 1988 disinflation attempts, and stayed constant after the 1974, 1978, and 1979 disinflation attempts. The separate contributions measured in the SF Fed’s supply- and demand-driven inflation series imply that the bulk of the decline of inflation in the early 1980s was attributable to supply.
Figure 2
Contributions to core inflation relative to September 2022
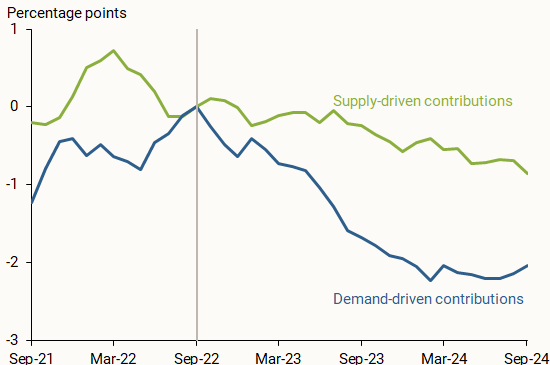
Note: Data reflect changes to 12-month core inflation relative to September 2022.
Source: Bureau of Economic Analysis and authors’ calculations.
Analyzing results with high-frequency policy shocks
One drawback of using attempted disinflations to assess the impact of monetary policy tightening is that there are very few episodes in our sample. Thus, to increase the reliability of our estimates we assess a larger data sample of high-frequency identified monetary policy surprises. Several researchers have constructed different series of such unexpected monetary policy changes, also known as shocks. We examine the response of the supply- and demand-driven contributions of core PCE inflation to two different policy shock series—one from Jarociński and Karadi (2020) and another from Bauer and Swanson (2023). Jarociński and Karadi (2020) isolate monetary policy changes by accounting for economic information revealed through monetary policy announcements. Bauer and Swanson (2023) isolate monetary policy changes by accounting for economic and financial news. We identify a date of a monetary policy tightening if the shock rises above the 90th percentile for that series. Both series have 35 dates that we register as monetary policy tightening.
Figure 3 reports the cumulative responses of core PCE inflation and its supply and demand contributions for 12 months after a monetary policy shock. We normalize each series such that a monetary policy shock represents a 0.25 percentage point increase in the federal funds rate. The estimates displayed in Figure 3 imply that this size of increase in the federal funds rate reduces core PCE inflation (gold bars) by a substantial amount. The decline is almost entirely driven by dampening the demand-driven contributions to inflation (blue bars). Specifically, the demand-driven contribution to core PCE inflation falls 0.5 percentage point over a 12-month period, whereas there is no statistically significant impact on the supply-driven component (green bars). The total impact on inflation is similar to that found in Bauer and Swanson (2023).
Figure 3
Cumulative responses to 1/4-point interest rate increase
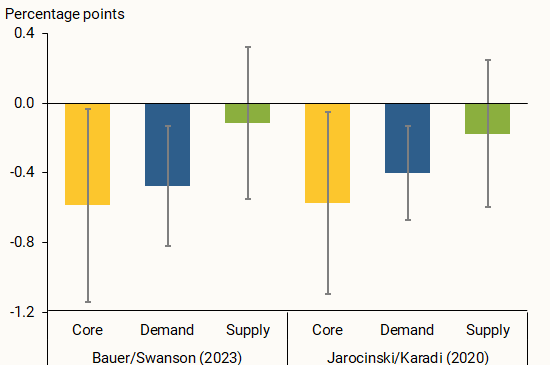
Note: Colored bars show 12-month cumulative responses to an unexpected quarter-point interest rate change based on two data series. Gray bands show the range of estimates with 90% confidence.
To assess the impact of monetary policy tightening on inflation over the recent tightening cycle, we apply these estimates to the recent changes in the federal funds rate, which increased from 0.125% in early 2022 to 5.375% in mid-2023. Combining the cumulative effects of each interest rate change through this period from our estimates reveals that the recent increase in the federal funds rate substantially reduced inflationary pressures. In particular, our estimates imply that year-over-year core PCE inflation would have been approximately 3 percentage points higher on average between 2022 and 2024 if the FOMC had not raised interest rates. In other words, if the Federal Reserve had not tightened policy, demand-driven inflation would have continued rising into 2023 instead of declining as it did. Since the impact on supply-driven inflation is negligible, this effect stems entirely from the demand-driven component of inflation.
Conclusion
The results in this Letter indicate that, when the FOMC has shown strong commitment to disinflation, monetary policy tightening has been successful at bringing inflation down. Specifically, the disinflation in these strong commitment episodes—most notably in the post-pandemic episode—was achieved by reducing demand-driven inflation rather than supply-driven inflation. Looking forward, core PCE inflation remains 0.8 percentage point above the Fed’s 2% goal. Our results suggest that monetary policy can continue to reduce demand-driven inflation with the FOMC’s continued commitment to reaching that goal.
References
Barth III, Marvin J., and Valerie A. Ramey. 2002. “The Cost Channel of Monetary Transmission.” NBER Macroeconomics Annual 2001, volume 16, pp. 199–240.
Bauer, Michael D., and Eric T. Swanson. 2023. “A Reassessment of Monetary Policy Surprises and High-Frequency Identification.” NBER Macroeconomics Annual 2022, pp. 87–155.
Jarociński, Marek, and Peter Karadi. 2020. “Deconstructing Monetary Policy Surprises—The Role of Information Shocks.” American Economic Journal: Macroeconomics 12(2), pp. 1–43.
Romer, Christina D., and David H. Romer. 2024. “Lessons from History for Successful Disinflation.” Journal of Monetary Economics 103654.
Shapiro, Adam Hale. 2022. “How Much Do Supply and Demand Drive Inflation?” FRBSF Economic Letter 2022-15 (June 21).
Shapiro, Adam Hale. 2024. “Decomposing Supply‐and Demand‐Driven Inflation.” Forthcoming in Journal of Money, Credit and Banking.
Opinions expressed in FRBSF Economic Letter do not necessarily reflect the views of the management of the Federal Reserve Bank of San Francisco or of the Board of Governors of the Federal Reserve System. This publication is edited by Anita Todd and Karen Barnes. Permission to reprint portions of articles or whole articles must be obtained in writing. Please send editorial comments and requests for reprint permission to research.library@sf.frb.org