

Monetary policy is forward-looking and dependent on policymakers’ economic outlook. When the outlook is deemed highly uncertain, policymakers may put more weight on incoming data when making monetary policy considerations. However, falling survey response rates suggest employment and inflation data may have become less reliable. Analysis of payroll employment and consumer price inflation data shows that data revisions over the past few years have been in line with their pre-pandemic averages. This suggests that these data have not been an outsized source of uncertainty in recent years.
Monetary policymaking is uncertain by nature. Former Federal Reserve Chairman Alan Greenspan emphasized, “Uncertainty is not just an important feature of the monetary policy landscape; it is the defining characteristic of that landscape” (Greenspan 2003). For policymakers, this uncertainty is compounded by the need to take a view about the future to calibrate policy. This is because the full impact of a change in interest rates on the economy is not immediate and arises after a substantial lag. As a result, policymakers must be forward-looking and use economic forecasts to calibrate the appropriate level of interest rates.
But there are times when forecasting is even more perilous. For instance, the extraordinary movements of the economy during and following the COVID-19 pandemic led policymakers and professional forecasters to make large forecast errors about inflation (Abdelrahman, Lansing, and Oliveira 2024). More recently, uncertainty about potential tariff increases and regulatory changes has been high: Details on the magnitude, scope, and timing of these changes are still in flux, such that precisely estimating their effects on inflation and other variables is challenging.
In such situations, policymakers may naturally put less weight on their forecasts and let the evolution of incoming data have more influence on their actions (see, for example, Daly 2023). This avoids making costly mistakes given the high degree of forecast uncertainty. However, putting more weight on incoming data also has risks. Because the response rates for many surveys that underlie important economic data series have declined substantially over the past decade, policymakers may wait until they are more confident that movements in the data are accurate and significant, and not the result of measurement errors. If perceptions of data uncertainty are high, it could delay policy adjustments.
Our Economic Letter assesses this possibility by examining the degree of short-term revisions in employment and consumer price index (CPI) inflation data over the past decades. We find that these revisions have been of roughly the same size over the past two to three years as they were in the years preceding the pandemic. Our findings ease some concerns about data uncertainty and the possibility that monetary policy may become too gradual as a result.
Forecasts and data dependence
A well-documented fact about monetary policy is that it affects the economy with a lag. While changes in the federal funds rate are quickly reflected into financial prices, such as stock prices and mortgage rates, it takes time for changes in financial conditions to affect consumer and business behaviors. Because of these lags, policymakers must anticipate where the economy is likely to be in the future. They must then account for this forecast when adjusting the federal funds rate to steer the economy towards the Fed’s dual mandate goals of price stability and maximum employment.
However, data dependence captures the idea that monetary policy is never on a preset course (Powell 2019). It is constantly being updated with new data. If the incoming data turn out to be different than expected, forecasts may be updated, and the outlook for policy may change as a result. The degree to which policymakers react to incoming data partly depends on how much confidence they have in their outlook. When confidence is high, it may require several data readings that diverge from expectations to change policymakers’ views. By contrast, if they view the outlook as highly uncertain, policymakers may put more weight on incoming data and relatively less weight on their own forecasts.
Survey response rates
Short-term movements in data can be highly volatile. As a result, one surprising reading of a particular economic indicator is unlikely to change policymakers’ perspectives about the state of the economy. However, assessing the economy in real time may have become more difficult because the response rates have declined for many household and business surveys used to compile economic data. This is concerning because a small sample size may be less representative and therefore give an inaccurate picture of the economic environment. This is a well-documented issue, and statistical agencies are working to address declining response rates (see, for example, the Current Population Survey response rate improvement plan).
Figure 1 shows the change in the response rate of the Current Employment Statistics (CES) surveys, which the Bureau of Labor Statistics (BLS) uses to compile the monthly job numbers in their establishment survey, a key economic indicator. The figure highlights a pronounced decline in the response survey rate that roughly coincided with the start of the pandemic. While the response rate was hovering around 60% for the decade preceding the pandemic, it has since declined to less than 45%.
Figure 1
Response rate to Current Employment Statistics surveys
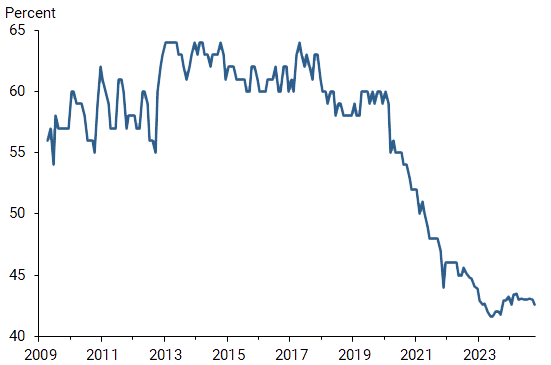
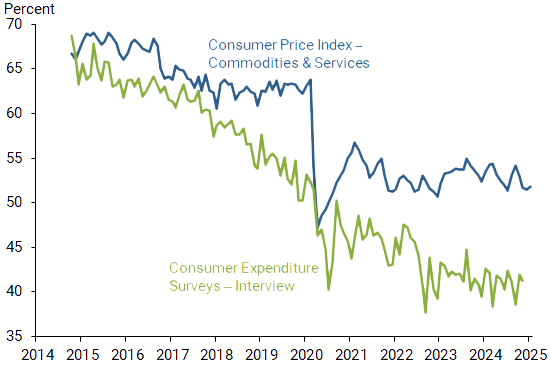
Figure 2 displays the response rates for two BLS surveys that form the basis for the calculation of the CPI. The CPI commodities and services survey collects price quotes for unique items and services from businesses, while information from the Consumer Expenditure Surveys is used to determine the weights used in the CPI calculations. The response rates shown in Figure 2 have dropped significantly since late 2014—approximately 30 percentage points in one case—with the pandemic having a noticeable and, so far, lingering effect on these response rates.
Figure 2
Response rates to selected CPI-related BLS surveys
The impact of the pandemic made it more difficult to reach businesses either in person or by phone to collect the data, and survey response rates have not yet recovered to their pre-pandemic levels. However, declines in response rates predate the pandemic (see BLS note on survey response rates). Interestingly, this pattern is not only happening in the United States but also plagues other advanced economies (Flodberg and Wasén 2024).
Because of the decline in response rates, incoming data may have become less accurate and subject to larger revisions, which would compound the challenges policymakers face in assessing the current state of the economy. This may be particularly concerning when the outlook is highly uncertain, in that policymakers may wish to put more weight on incoming data to guide their policy decisions.
Data revisions
To examine whether declining response rates are introducing more volatility into the data, we look at data revisions using the Philadelphia Fed’s Real-Time Data Set. This data set reports how data have been revised over time, as statistical agencies obtain more information—for instance, through unemployment insurance programs, which require all employers to report employment information—and refine their estimates. We first look at monthly payroll employment gains from the CES given their importance for policymakers and financial market participants, as well as the broader public.
Figure 3 shows the average monthly revision per year since 1990, using the absolute value of the change between the first release and revised second release of the data. The second release provides a refined estimate usually one month after the initial release for a given month. We find similar results (not shown) when comparing the first data release for a given month and the latest available data release, which incorporates further adjustments, as well as when we scale the revisions by total payroll employment for each month as first reported.
Figure 3
Average absolute revision in payroll employment gains
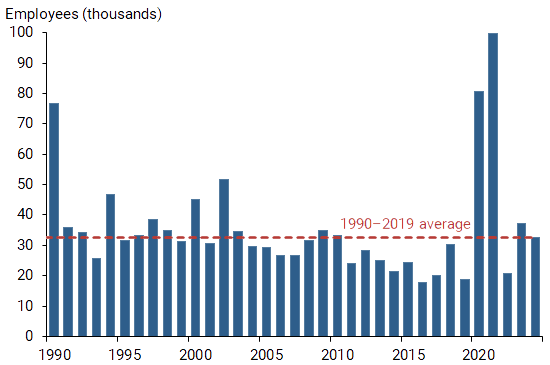
Source: Bureau of Labor Statistics via the Philadelphia Fed and authors’ calculations.
The figure clearly shows that the pandemic disrupted the flow of information. The revisions to payroll numbers in 2020 and 2021 dwarfed the typical revisions in prior years. One noticeable exception is the average revision in 1990, which reflects historically high revisions in the months leading up to the onset of the 1990–91 recession.
The large revisions in 2020 and 2021 complicated policymakers’ understanding of the state of the economy during the pandemic. In particular, uncertainty in employment data in the summer and fall of 2021 blurred assessments of labor market performance, which looked a lot weaker at the time than they did after the data were revised (Waller 2023).
In addition, the figure shows that employment data revisions since 2022 have been roughly in line with the average between 1990 and 2019 (red dashed line). Thus, despite the substantial decline in response rates, the incoming data are reassuringly not subject to greater noise, and thus greater uncertainty, than in the past.
A similar pattern emerges when looking at revisions to CPI inflation, as Figure 4 shows. We see a significant increase in the size of revisions in 2022 related to the rise in inflation following the pandemic. The data show similar increases leading up to and around the Global Financial Crisis in 2007 and 2008, and then again in 2011. But since 2022, the average revisions have been in line with the pre-pandemic historical average (red dashed line) starting in 1999, the first full year of data for which month-to-month CPI data are readily available in the Philadelphia Fed’s Real-Time Data Set. Unlike month-to-month revisions to payroll employment numbers, the BLS usually revises CPI data once a year as part of their annual seasonal adjustment updates.
Figure 4
Average absolute revision in headline CPI inflation
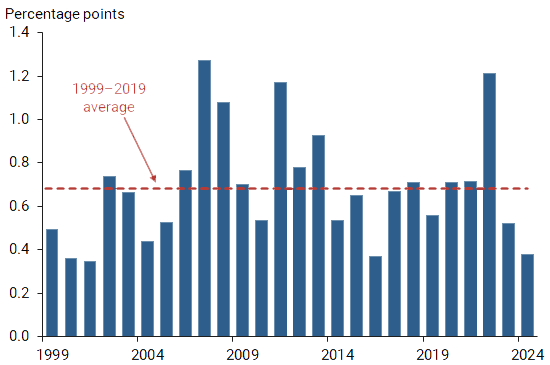
Source: Bureau of Labor Statistics via the Philadelphia Fed and authors’ calculations.
Conclusion
Reliable data help policymakers in their data-dependent approach to monetary policy. This is particularly true if confidence in a murky outlook is low, and more weight is placed on incoming information. Because the response rates of many household and business surveys have been declining, the incoming data may have become more uncertain and less reliable than in the past. Our Letter shows that this is not the case for important labor market and inflation measures. Over the past two to three years, the revisions to payroll numbers and CPI inflation rates have been in line with their pre-pandemic averages. While at this point these results are reassuring for the data-dependent approach to monetary policy, a reversal of the downward trend in survey responses would still be welcome for the reliability of future data.
References
Abdelrahman, Hamza, Kevin Lansing, and Luiz E. Oliveira. 2024. “Examining the Performance of FOMC Inflation Forecasts.” FRBSF Economic Letter 2024-29 (November 12).
Daly, Mary C. 2023. “Calibrating Policy in an Uncertain Time.” Remarks to the Salt Lake Chamber, Salt Lake City, UT, April 12.
Flodberg, Caroline, and Pernilla Wasén. 2024. “Lower Response Rates Implies Challenges for Monetary Policy in Several Countries.” Sveriges Riksbank Economic Commentary 11 (June 10).
Greenspan, Alan. 2003. “Monetary Policy Under Uncertainty.” Remarks at a symposium sponsored by the Federal Reserve Bank of Kansas City, Jackson Hole, WY, August 29.
Powell, Jerome H. 2019. “Data-Dependent Monetary Policy in an Evolving Economy.” Speech at “Trucks and Terabytes: Integrating the ‘Old’ and ‘New’ Economies,” 61st Annual Meeting of the National Association for Business Economics, Denver, CO, October 8.
Waller, Christopher J. 2023. “Using Economic Data to Understand the Economy.” Speech at “Beyond the Numbers,” conference hosted by the Research Division of the Federal Reserve Bank of St. Louis, St. Louis, MO, November 7.
Opinions expressed in FRBSF Economic Letter do not necessarily reflect the views of the management of the Federal Reserve Bank of San Francisco or of the Board of Governors of the Federal Reserve System. This publication is edited by Anita Todd and Karen Barnes. Permission to reprint portions of articles or whole articles must be obtained in writing. Please send editorial comments and requests for reprint permission to research.library@sf.frb.org