

Wildfires have been a concern in California for decades. The intensity of these events has increased recently, with particularly large and destructive fire seasons between 2018 and 2021. Analysis shows that distance from high fire-risk zones had little impact on residential housing values in the past. However, that has changed since the late 2010s, coinciding with more extensive fire damage to land and structures across the state. Insurance availability appears to help little in preserving home values in areas that are considered more at risk.
Wildfires have damaged property in the state of California for decades, and fire risk in the state is elevated relative to most of the United States (Aylward and Oliveira 2020). Historical data from California’s state fire agency, CAL FIRE, recorded over 300,000 fire episodes in the state between 1987 and 2022. The size and intensity of these episodes have increased in recent years, along with their estimated costs. In the 1990s, a little over 415,000 acres burned on average each year; this annual average increased to just over 775,000 acres in the 2010s. At the same time, the number of structures destroyed by fires increased from about 355 yearly on average in the 1990s to an annual average of about 4,055 in the 2010s. This increase is due partly to a series of especially damaging fires in 2017 and 2018 and partly to an increase in residential use of areas deemed as high fire-risk zones (Mockrin et al. 2023).
The increases in severity, structure damage, and residential use of areas with high fire risk suggest that wildfire risk could negatively affect the residential real estate market in California, particularly as the state continues to struggle with a shortage of available housing units. Indeed, earlier research indicates that wildfires negatively impact residential real estate values of properties located near but generally not inside burned areas in southern California (Mueller, Loomis, and González-Cabán 2009).
In this Economic Letter, we estimate the effects of wildfire risk as measured by the distance from recent wildfires on residential real estate values. Our results suggest that property values have been more adversely impacted in recent years by being close to past wildfires than was the case previously. Moreover, while having insurance can help mitigate some of the costs associated with fire episodes, our results suggest that insurance does little to improve the adverse effects on property values.
Wildfires and residential areas in recent decades
Figure 1 summarizes wildfire activity in California from 1984 through 2021. It shows the number of wildfires and the average acreage burned per fire for wildfires exceeding 1,000 acres. The figure shows that, while the number of wildfires each year does not follow any particular trend over time, the area burned by wildfires has increased substantially, particularly in recent years.
Figure 1
California wildfires and acres burned
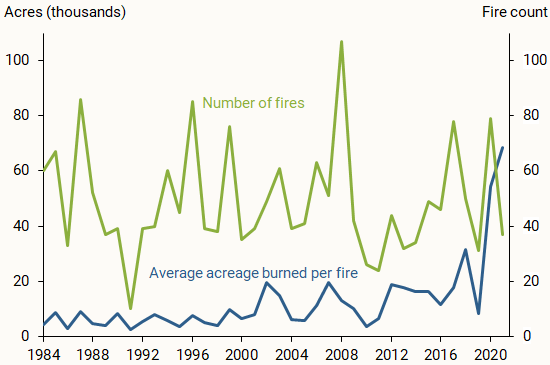
Source: Monitoring Trends in Burn Severity and author’s calculations.
At the same time, the number of homes built in areas deemed as high risk has also increased over time. For example, a 2023 report from the USDA Forest Service estimated that the share of housing in the wildland-urban interface increased about 40% in California from 1990 to 2020 (Mockrin et al. 2023). The wildland-urban interface is generally regarded as having high fire risk.
Wildfire risk and housing values
The increasing intensity of wildfires and the growing exposure to high-risk areas have implications for real estate markets in California. We examine this issue using data from different sources. We use wildfire data from the Monitoring Trends in Burn Severity (MTBS) database of 1,000-plus acre fires, particularly information about each fire’s burn perimeter and ignition date, to measure past fire activity. Housing market data come from annual parcel-level administrative tax records obtained through CoreLogic. These data contain information on each property’s value, characteristics such as lot and building size, and location including zip code. We focus on single-family owner-occupied homes and analyze annual data at the zip code level. To measure wildfire risk, we identify the five wildfires closest to each zip code in each year, calculate the distances between the zip code and these five wildfire burn perimeters, and take an average. We use the geographic center of each zip code to calculate distances to the fire perimeters.
We estimate the relationship between distance from past wildfires and residential real estate values, controlling for other factors that can help explain variation in home values over time and across zip codes. These factors include property characteristics such as lot size, building square footage, and other property amenities. Importantly, we also account for trends over time by including average home values in the state and for typical differences in home values between zip codes by using zip code level averages. This means that the relationships we identify between wildfires and home values are driven by comparisons within a zip code rather than comparisons across zip codes. We omit zip codes with geographic centers within about 3 miles (5 kilometers) of fire perimeters to avoid using data on homes that may have been destroyed by fire. Finally, we estimate this relationship for wildfires that happened in the current year, the year before, two years before, and three years before to examine how a previous fire may affect values today. For brevity, here we focus on the effects of wildfires that happened three years before, since those patterns are similar to the patterns from earlier past fires.
Figure 2 reports the estimated relationship between the average distance in hundreds of miles to the zip code’s five closest wildfires and the average home values in the zip code. The blue dot shows the results using the first part of our sample, from 2008 to 2017. The green dot reports results for the most recent period, from 2018 to 2021. The red dot will be discussed in a later section. The bars around each data point show the statistical significance within a 95% confidence range. The positive values indicate that homes farther from past fires tend to have higher property values. Comparing the two results shows that the estimated relationship between distance from fire zones and home values was stronger in the more recent sample. While the change is notable, the effects are relatively small. Even in the late sample, being farther from past fires is associated with a boost in home value of about 2% for homes of average value.
Figure 2
Relationship between wildfire distance and home values
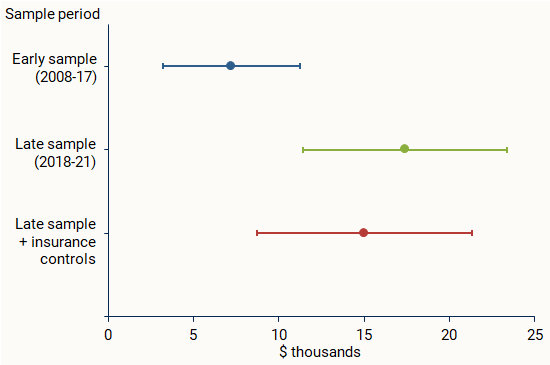
Source: MTBS, CoreLogic, and author’s calculations.
This change in patterns roughly aligns with the increasing wildfire intensity in California. The recent large fires may have changed homeowners’ perceptions of fire risk, which could alter how they view the tradeoff between amenities associated with living in risky areas and potential damages from wildfires (Donovan, Champ, and Butry 2007).
Using our estimates, we calculate the cumulative average effect of wildfires in 2021 and the three years prior on home values in each zip code. This calculation takes into account how far each zip code was from the closest five fires in 2021, 2020, 2019, and 2018. Figure 3 shows these estimates relative to the statewide average—that is, the difference between the estimated cumulative effect for each zip code and the average cumulative effect in the state.
Figure 3
Cumulative effects of 2018-2021 fires on home values
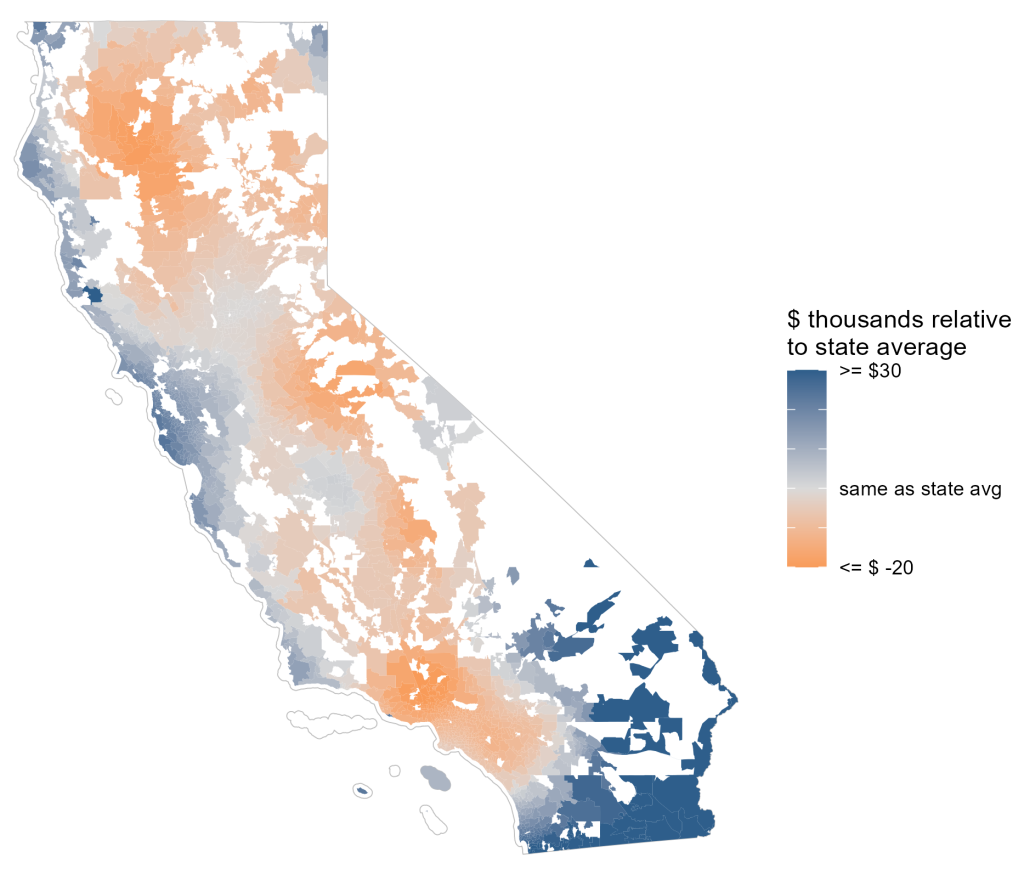
Source: MTBS, CoreLogic, and author’s calculations.
The figure shows wide variation across zip codes. In particular, coastal regions in central and northern California and arid desert regions in the extreme south experienced benefits relative to the average, shown as positive values, as these areas were farther than average from wildfires. In contrast, in vegetated and mountainous areas around Los Angeles and in the Sierras, wildfires lowered home values relative to the average, as these areas were closer to where wildfires burned.
Does insurance help home values?
Since our results indicate that wildfire risk may lower home values, we assess whether homeowners can counterbalance this risk with homeowner’s insurance.
Homeowners can obtain insurance through the private market or through the state-created California FAIR plan. The latter option is an alternative for homeowners who are not able to obtain insurance in the private market. The FAIR plan costs more and offers less generous coverage, protecting only the homeowner’s dwelling, as opposed to most plans that also cover personal belongings and have other benefits. As such, the FAIR plan use gives an indication of the quality of insurance homeowners can access. The FAIR plan market share is small for the residential market we study—about 3% in 2021—and its market share and market share growth vary across the state. Areas with higher FAIR plan use and growth tend to be those that face higher wildfire risk, such as hilly, mountainous, or heavily forested regions.
We use policy-level insurance data from the California Department of Insurance (CDI), which allows us to estimate insurance coverage rates for different types of policies. We add two measures of zip-code level insurance coverage to our model. The first is the percent of homes with private or public insurance. The second is a proxy for FAIR plan use, which captures coverage quality. Although the policy-level CDI data do not explicitly identify which plans are FAIR plans, the percent of homes with “dwelling only” insurance gives a good indication. Because of the noted association between FAIR plan use and wildfire risk, we also control for the proportion of insured homes that are designated as having high fire risk.
Using these insurance data, we revisit our analysis from Figure 2 to control for insurance access, shown by the red dot in Figure 2. Comparing the green and the red dots shows that controlling for risk classification and insurance access does little to limit the impact of distance to fire zones on home values.
Conclusion
This Letter assesses how living with wildfire risk has affected home values in California in recent years. While wildfire-prone areas offer scenery and green spaces that homeowners seek, measures of changing home values in recent years indicate that the risks may outweigh the benefits, even accounting for potential protection from homeowner’s insurance. This pattern may become stronger in years to come if residential construction continues to expand into areas with higher fire risk and if trends in wildfire severity continue.
References
Aylward, James, and Luiz E. Oliveira. 2020. “Rising Wildfire Risk for the 12th District Economy.” FRBSF Economic Letter 2020-19 (July 13).
Donovan, Geoffrey H., Patricia A. Champ, and David T. Butry. 2007. “Wildfire Risk and Housing Prices: A Case Study from Colorado Springs.” Land Economics 83(2), pp. 217–233.
Mockrin, Miranda, Barbara McGuinness, David Helmers, and Volker Radeloff. 2023. Understanding the Wildland-Urban Interface (1990–2020). Madison, WI: U.S. Department of Agriculture, Forest Service, Northern Research Station.
Mueller, Julie, John Loomis, and Armando González-Cabán. 2009. “Do Repeated Wildfires Change Homebuyers’ Demand for Homes in High-Risk Areas? A Hedonic Analysis of the Short and Long-Term Effects of Repeated Wildfires on House Prices in Southern California.” Journal of Real Estate Finance and Economics 38, pp.155–172.
Opinions expressed in FRBSF Economic Letter do not necessarily reflect the views of the management of the Federal Reserve Bank of San Francisco or of the Board of Governors of the Federal Reserve System. This publication is edited by Anita Todd and Karen Barnes. Permission to reprint portions of articles or whole articles must be obtained in writing. Please send editorial comments and requests for reprint permission to research.library@sf.frb.org